By combining atomic force microscopy (AFM) and infrared spectroscopy (IR) techniques, known as AFM-IR, samples can be chemically characterized at the nanoscale, providing detail that would not be possible with the two techniques alone.
AFM-IR spectroscopy, also known as nanoscale IR spectroscopy, has an ever growing list of application areas, including in microelectronics, pharmaceutical science, polymer characterization and life sciences.
This article presents the principles of AFM-IR, explores its advancements and provides examples of AFM-IR applications in life science. More specifically, it discusses the nanoscale characterization of biological samples, including tissues, proteins, monolayers and structures within single cells.
Principles and Advancements of Photothermal AFM-IR
Infrared (IR) spectroscopy is a popular analytical technique for characterizing materials and chemical analysis by academic, industrial and governmental R&D laboratories.
Although conventional bulk IR spectroscopy has many useful applications, it has a diffraction limit of 3 to 10 μm.
Atomic force microscopy (AFM) is a ubiquitous nanoscale imaging technique, providing users with a high spatial resolution (approx. 1 nm) topographic map of a sample surface. Whilst AFM is valuable for visualizing the surface of a material; it is not capable of chemically characterizing the material of interest.
However, when combined with a source of IR, the resulting AFM-IR technique reduces the diffraction limit of conventional IR spectroscopy by orders of magnitude. This combination provides the high-resolution imaging capabilities of AFM while allowing for the chemical analysis of the material by the IR spectrophotometer.1,2
The photothermal AFM-IR system operates by first illuminating the sample with a pulsed tunable IR laser. The IR radiation will be absorbed if the wavenumber of the laser source resonates with a molecular vibrational frequency in the sample.
After exchanging energy with the sample matrix, the molecules return to their ground vibrational state. The sample then thermally expands over an area corresponding with the focused IR laser spot.
Resulting from the local thermal expansion of the material in proximity to the tip of the AFM probe, the cantilever can begin to oscillate; the subsequent oscillation is proportional to the radiation absorbed by the sample.
As the cantilever and tip begin to track across a sample, topographical data and chemical images are collected at the nanoscale.
During the initial configuration of photothermal AFM-IR, the optical parametric oscillator (OPO) tunable laser source has a pulse length of ~10 ns and a repetition rate of 1 kHz.
This results in the rapid expansion of the sample, prompting an impulse in the cantilever, causing the cantilever oscillation to ring down at its natural resonance frequencies after each laser pulse.
More recent advancements of photothermal AFM-IR replace the OPO tunable laser source with a variable repetition rate quantum cascade laser (QCL). This results in an enhancement of the photothermal AFM-IR signal by two orders of magnitude (Figure 1).
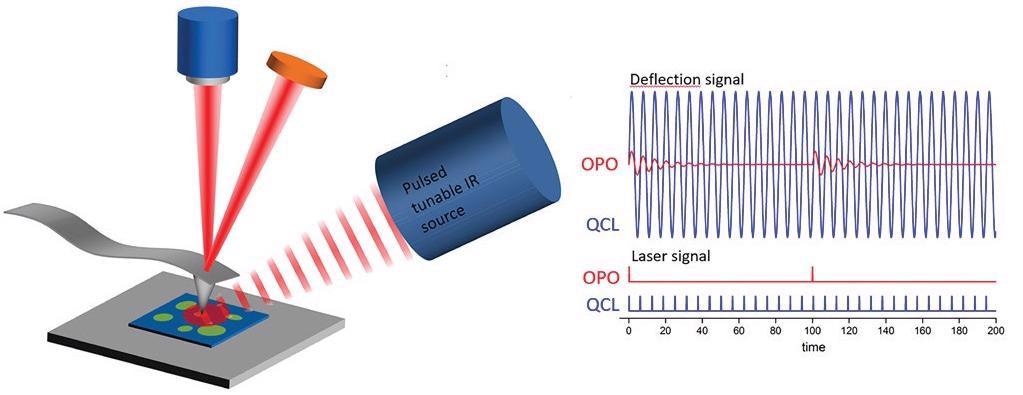
Figure 1. Optical diagram of an AFM-IR experiment showing the difference between the signal responses using a 1-kHz repetition rate OPO laser source and a QCL source with its repetition rate tuned to a contact resonance frequency mode of the AFM cantilever. Adapted from Marcott et al5. Image Credit: Bruker Nano Surfaces
This improvement is achieved by tuning the QCL repetition rate to match the contact resonant frequency mode of the AFM cantilever.3,4 At the contact resonance, the oscillation amplitude of the cantilever is greatly increased relative to off-resonance frequencies.
The AFM-IR signal can be improved further by using a gold-coated AFM tip. This results in a “lightning rod” effect, localizing the electric field at the tip apex.
By utilizing a gold-coated probe, as well as matching the repetition rate of the laser to the contact resonance of the AFM cantilever, IR spectra can be obtained for samples down to ~10 nm in thickness.
If a thin film sample is deposited onto a gold substrate, the local electric field can be enhanced further, allowing for measurements down to 1 nm. Thus, the photothermal AFM-IR technique, if operated in resonance-enhanced mode, can detect monolayer coverages of material on metal surfaces at lateral spatial resolutions as high as 25x25 nm.
Examples of AFM-IR Applications for Characterizing Biological Samples
AFM-IR has been used to answer a multitude of research questions in the life sciences and characterize an array of biological samples.
Examples of the nanoscale characterization of biological samples, including tissues, proteins, monolayers, and structures within single cells, are provided below. These results would not have been obtainable without the utilization of AFM-IR techniques.
Detection of Photocycle Branching of Bacteriorohodpsin Molecules Embedded in Purple Membrane on a Gold-coated Substrate
The study by Giliberti et al. (2019) used AFM-IR to investigate the light-induced conformational changes of a bacteriorhodopsin (BR) mutant within patches of the purple membrane of Halobacterium halobium – a light-harvesting microorganism.6
BR is a photosensitive protein that acts as a proton pump. By moving protons across the membrane, light energy is subsequently converted into chemical energy. The conformational changes that occur in this light-sensitive protein and its cofactor are the basis of their physiological functions.
IR and AFM spectroscopy techniques are not sufficient on their own to study this system, as it requires chemical characterization in nanoscale detail.
AFM can be used to detect electrical currents traveling through protein monolayers but not conformational changes in proteins. Traditional IR spectroscopy can be used to track conformational changes in proteins, but the sample must typically be a thick film or liquid suspension containing a high volume of purified protein.
By using AFM-IR techniques with the addition of a gold surface and gold-coated AFM, the study found a significant improvement in the signal-to-noise ratio when compared to standard IR nanospectroscopy.
Additionally, IR difference-spectra in the 1450-1800 cm-1 range were recorded from monolayer sample areas as thin as 10 nm and with a diameter of less than 500 nm. This by far exceeds the diffraction limit of traditional IR spectroscopy.
Owing to the nanoscale level of detail provided by the AFM-IR, there was strong spectroscopic evidence of branching in the photocycle of BR molecules on the gold surfaces.
This is where equal amounts of proteins are present following either the proton-pump photocycle or exist in an intermediate state and do not contribute to the photocycle.
This study acts as a model for future AFM-IR spectroscopy studies that investigate conformational changes of proteins embedded in membranes.
Detection of a Secondary Structure of Alzheimer’s-related Protein in Water
The study by Ramer et al. (2018) conducts nanoscale polypeptide conformational analysis in aqueous environments.7
Typically, proteins function by folding into three-dimensional structures and binding to other molecules, forming functional complexes. It is recognized that IR spectroscopy is an important tool for chemically characterizing the secondary structure of proteins both in solid and aqueous states.
However, the diffraction limit of traditional IR spectroscopy has a resolution of 3-10 μm laterally, so previously, nanoscale protein structures could not be chemically analyzed.
The nanoscale chemical characterization capability of AFM-IR has facilitated the identification of polypeptide conformations in single protein fibrils and other submicron-sized protein structures. This has led to a greater understanding of important processes, such as protein aggregation and misfolding mechanisms.
As part of this research, AFM-IR was employed to probe supra-molecular aggregates of diphenylalanine, the core recognition module of the Alzheimer’s B-amyloid peptide, as well as its derivative, Boc-diphenylalanine.
By using AFM-IR, the authors acquired high-resolution IR spectra and maps in water and air substrates – these resulted in comparable signal-to-noise ratios. Subsequently, this enabled the identification of structural and chemical states of morphologically similar networks at the single aggregate level, such as fibril (Figure 2).
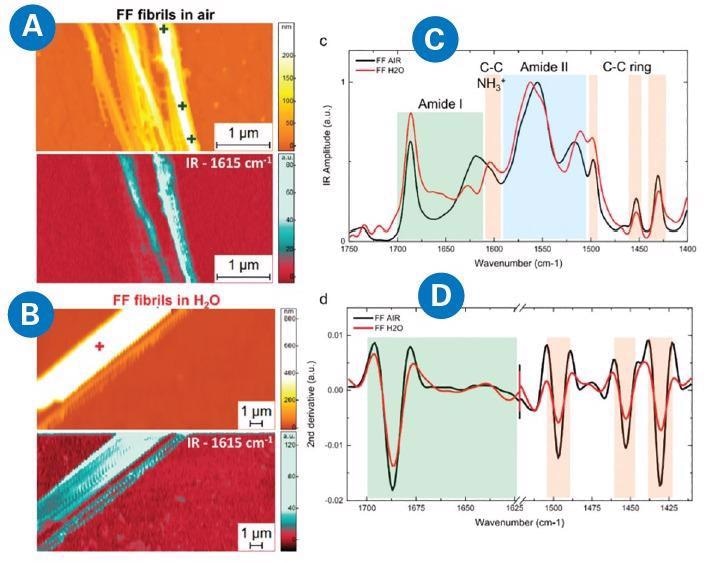
Figure 2. AFM-IR measurement of diphenylalanine (FF) fibrils in air and H2O. morphology and IR absorption map (1615 cm−1) for FF fibrils in (A) air and (B) H2O. (C) Comparison of the average AFM-IR spectra covering the amide I band (green), amide II (blue), and C−C ring (orange) spectral regions. (D) Comparison of the second derivatives of the spectra in the amide band I and C−C ring absorption. Adapted from G. Ramer, F.S. Ruggeri, A. Levin, T.P.J. Knowles, and A. Centrone, ACS Nano 12, 6612−6619 (2018)7. Image Credit: Bruker Nano Surfaces
For example, chemical data was easily collected from individual fibrils smaller than 200 nm laterally. Obtaining such high resolution would not have been possible with classical IR spectroscopy alone.
Before this study, AFM-IR had only been performed on dried materials because of concerns that the drying out of a protein-containing material may result in a conformational change in the protein backbone structure. The success of using AFM-IR for an aqueous sample in this study serves as proof of concept.
Phenotyping the Malaria Parasite during Development in Red Blood Cells
Perez-Guaita et al. (2018) used multivariate image analysis to produce multivariate AFM-IR maps to facilitate the collection of high-resolution, sub-cellular information in red blood cells infected with the malaria parasite, Plasmodium falciparum, at an array of stages throughout development.8
This methodology uniquely supported the generation of compositional maps of subcellular structures in the parasites, including lipid inclusions, the food vacuole, and the nucleus, based on the intensity of lipid, hemoglobin, hemozoin and DNA IR marker bands, respectively (Figure 3).
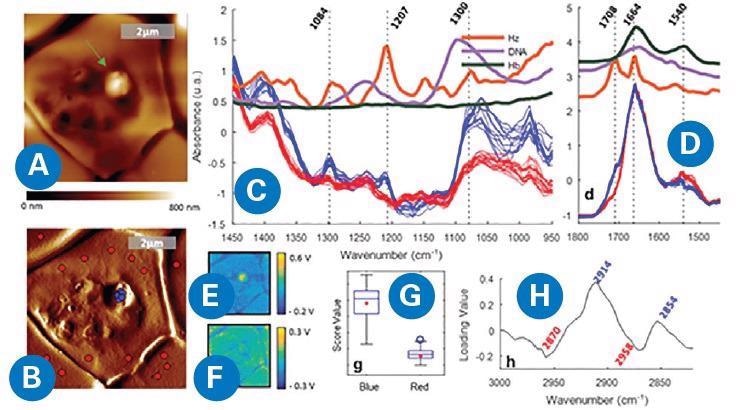
Figure 3. AFM-IR imaging of a P. falciparum trophozoite inside a red blood cell. (A) AFM topography. (B) AFM deflection map showing the location of the points where spectra were measured, inside (blue) and outside (red) of the protrusion. (C, D) Spectra measured from the signal of the IR intensity peak (V) showing different bands for the red and blue spots in the 1450−950 and 1800−1450 cm−1 regions, respectively. (E, F) IR peak maps obtained at 1207 and 1660 cm−1, respectively. (G, H) Score and loading plots from the PCA applied to the 3100−2800 cm−1 region. D. Perez-Guaita, K. Kochan, M. Batty, C. Doerig, J. Garcia-Bustos, S. Espinoza, D. McNaughton, P. Heraud, and B.R. Wood. Anal. Chem. 90, 3140−3148 (2018)8. Image Credit: Bruker Nano Surfaces
By combining hyperspectral data modeling with the high-resolution of AFM-IR, subcellular structures were identified directly, removing the need for biochemical staining or cell sectioning.
With the ability to phenotype the parasite development within red blood cells, this technology can facilitate the study of the phenotypes of drug-resistant parasites and potential modes of action for antimalarial drugs.
In Vivo Detection of Molecular Changes during Cellular Processes in Bacteria
AFM-IR has been applied to the in vivo detection of molecular changes during cellular processes in single cells of bacteria. Kochan et al. employed AFM-IR spectroscopy to observe nanoscale molecular changes in the cell wall of the bacteria Staphylococcus aureus during cell division.9
Dynamic changes in the cell wall occur while Staphylococcus aureus undergoes cell division. Such changes include alternations in molecular components and the thickening of the septum (Figure 4). The diameter of the newly formed septum was approximately 45 nm.
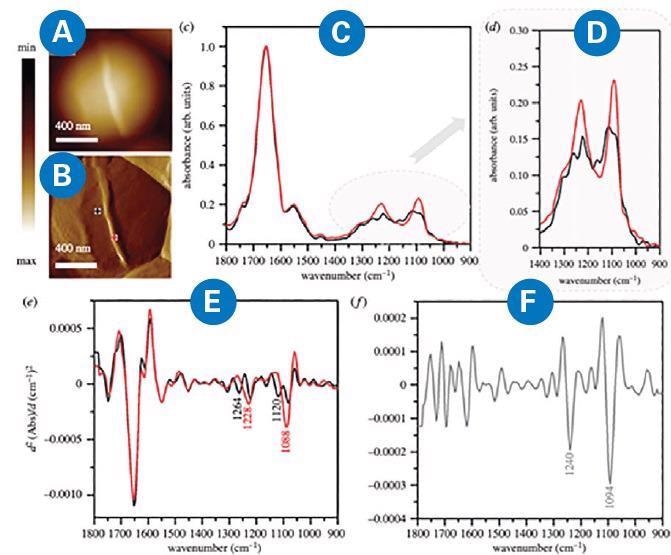
Figure 4. (A) AFM height and (B) AFM deflection image of the dividing cell collected prior to recording AFM-IR spectra at the marked points, from which spectra were recorded (non-septum in black and forming septum in red). Size of the area imaged by AFM: 1.17 1.15 mm. (C, D) Comparison of AFM–IR spectra recorded from septum (red) and non-septum (black) of the S. aureus cell during division in the spectral range (C) 1800–900 cm-1 and (D) 1400–900 cm−1. Spectra were normalized to amide I band. (E) The second derivatives of spectra presented in (C), with marked prominent differentiating bands. (F) The second derivative of a differential spectrum obtained by subtraction of non-septum spectrum (C, black) from the septum spectrum (C, red), with prominent bands marked. Adapted from Kochan et al9. Image Credit: Bruker Nano Surfaces
The AFM-IR spectrum obtained from this structure exhibited increased intensity and broadening of some bands (centered at 1228 and 1088 cm-1 and attributed to phosphodiester and carbohydrate groups of cell-wall components) when compared with a spectrum from an area outside the septum.
The second derivative of a differential spectrum, acquired by subtraction of a non-septum spectrum from the septum spectrum, displayed bands centered at 1240 and 1092 cm-1 (phosphodiester and carbohydrate modes).
Chemically characterizing the septum structure in a live cell at a high resolution is only possible with AFM-IR. This study exhibits the capability of AFM-IR as a tool to obtain molecular insights into cellular processes in vivo and in nanoscale detail.
In a later study by Kochan et al., chemometric analysis was combined with AFM-IR spectroscopy to identify alterations in the chemical composition of Staphylococcus aureus. This study was concerned with the development of antibiotic drug resistance to daptomycin and vancomycin at the single-cell level.10
Kochan et al. focused on the use of paired clinical isolates to facilitate the assignment of specific changes to the development of resistance.
For vancomycin, a rise in carbohydrates was observed — this indicated thickening or changes in the packing of the cell wall. In contrast, in daptomycin, an increase in phospholipid content associated with the development of non-susceptibility was noted.
This study shows the potential application of AFM-IR techniques to antimicrobial resistance detection at the single bacterium level.
Tracking Biochemical Changes in Tumors in Salivary Gland Tissue
AFM-IR has been employed to define biochemical differences between tumorous and healthy salivary gland tissues. A study by Paluszkiewicz et al. (2020) was the first AFM-IR investigation of healthy salivary gland versus tumor tissue.11
Using AFM-IR, the study detected fibril-like areas within the tumor tissue, with the smallest characterized amyloid forms being 70 nm; this would have otherwise been undetected using traditional IR spectroscopy alone.
The IR spectra of the fibril-like structure of the tumor tissue and margin tissue (non-tumor), the areas outside of the fibrils of the tumor, were collected, as seen in Figure 5.
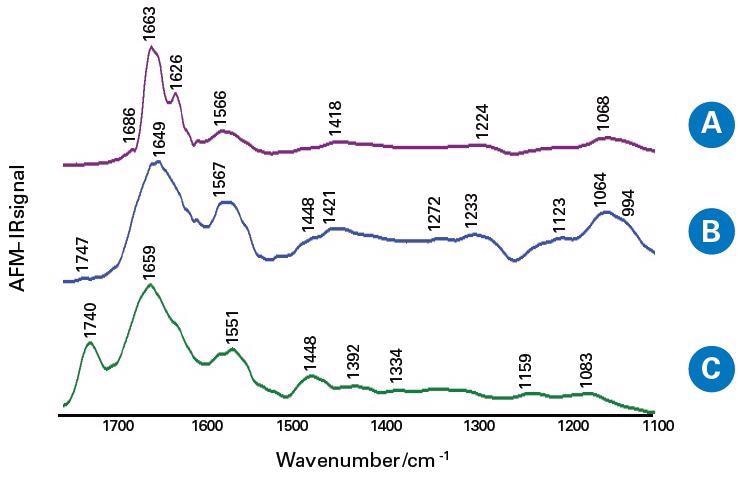
Figure 5. The averaged AFM-IR spectra of the salivary glands tissue sections in the spectral range 1800–900 cm−1; the fibril-like structure of tumor tissue (A), the areas outside the fibrils of tumor tissue (B) and the margin tissue (C). Image Credit: Bruker Nano Surfaces
Owing to the capabilities of nanoscale IR, authors observed higher β-sheet content in fibril-like areas within a salivary gland tumor, given by IR spectra, compared to regions within the tumor outside the fibrils.
This degree of secondary protein structure differentiation would not have been possible using Raman micro-spectroscopy or conventional IR.
The ability to detect biochemical differences between healthy tissue and tumor tissue may aid therapy progression through the development of drugs with specific action informed by research.
Summary
Nanoscale IR spectroscopy can be used to topographically and chemically characterize nanoscale biological samples, including tissues, proteins, monolayers and structures within single cells.
Photothermal AFM-IR uses an IR laser to irradiate a sample resulting in thermal expansion. The AFM tip detects thermal expansion, causing it to oscillate in proportion to the thermal expansion.
With the addition of a quantum cascade laser (QCL), the signal can be enhanced by two orders of magnitude when compared to conventional AFM-IR spectroscopy and imaging. This is because its repetition rate can be matched to specific mechanical resonance frequencies in the AFM cantilever.
A further two orders of magnitude enhancement in sensitivity can be attained by coating the AFM tip in gold and casting the sample films onto gold substrates.
It is the amalgamation of the “lightning rod” effect produced by coating the AFM tip in gold and substrate, along with resonance enhancement using the QCL source, that facilitates the detection of monolayers of material at spatial resolutions of 25 x 25 nm.
Even in the presence of water, photothermal AFM-IR with resonance enhancement is a proven valuable tool for obtaining chemical characterization of protein films and additional sample types in the life sciences.
The few examples discussed here outline how AFM-IR is already used to answer an array of different biological questions.
By using AFM-IR, researchers have made new findings in secondary structures in Alzheimer’s-related proteins, phenotypes of the development of the malaria pathogen in red blood cells, photocycle branching in bacteriorhodopsin molecules, biochemical changes in cancerous tissues and in vivo detection of molecular changes during cell processes.
AFM-IR is a uniquely practical and cutting-edge technology that provides researchers with the tools to answer questions that require nanoscale-level topographical and chemical analysis of biological samples and beyond.
Acknowledgments
Produced from materials originally authored by Curtis Marcott from Light Light Solutions, as well as Savana Lipps and Miriam Unger from Bruker.
References
- A. Dazzi, R. Prazeres, F. Glotin, and J.M. Ortega, Opt. Lett. 30, 2388-90 (2005).
- A. Dazzi and C.B. Prater, Chem. Rev. 117, 5146-5173 (2017).
- F. Lu and M.A. Belkin, Opt. Express 29, 19942-47 (2011).
- F. Lu, M. Jin, and M.A. Belkin, Nat. Photonics 8, 307-12 (2014).
- C. Marcott, H. Yang, C.B. Prater, and K. Kjoller, Spectroscopy 29(s8), 18-25 (2014).
- V. Giliberti, R. Polito, E. Ritter, M. Broser, P. Hegemann, L. Puskar, U. Schade, L. Zanetti-Polzi, I. Daidone, S. Corni, F. Rusconi, Paolo Biagioni, L. Baldassarre, and M. Ortolani, Nano Lett. 19, 3104−3114 (2019).
- G. Ramer, F.S. Ruggeri, A. Levin, T.P.J. Knowles, and A. Centrone, ACS Nano 12, 6612−6619 (2018).
- D. Perez-Guaita, K. Kochan, M. Batty, C. Doerig, J. Garcia-Bustos, S. Espinoza, D. McNaughton, P. Heraud, and B.R. Wood. Anal. Chem. 90, 3140−3148 (2018).
- K. Kochan, D, Perez-Guaita, J. Pissang, J.-H. Jiang, A.Y Peleg, D. McNaughton, P. Heraud, B.R. Wood, J. R. Soc, Interface 15: 20180115.
- K. Kochan, C. Nethercott, D. Perez−Guaita, J.-H. Jiang, A.Y. Peleg, B.R. Wood, and P. Heraud, Anal. Chem. 91, 15397−15403 (2019).
- C. Paluszkiewicz, N. Piergies, M.C. Guidi, E. Pięta, W. Ścierski, M. Misiołek, B. Drozdzowska, P. Ziora, G. Lisowska, and W. Kwiatek, BBA - General Subjects 1864, 129677 (2020).

This information has been sourced, reviewed and adapted from materials provided by Bruker Nano Surfaces.
For more information on this source, please visit Bruker Nano Surfaces.