An update to USP<1788> Methods for Determination of Subvisible Particulate Matter was released in May 2021.
Its goal is to assist in the support and clarification of the information provided in chapters <787> Sub-visible Particulate Matter in Therapeutic Protein Injections, <789> Particulate Matter in Ophthalmic Solutions and <788> Particulate Matter in Injections.
Its title before was “Methods for the Determination of Particulate Matter in Injections and Ophthalmic Solutions” and concentrated on the instrument and validation guidelines of microscopic techniques variability and Light Obscuration instruments.
With the emergence of novel therapeutic protein solutions and Flow Imaging technologies, the scope was broadened.
The updates to the document include a practical orthogonal technique that offers supplementary morphology data.
A better knowledge of particle type assists in establishing the source of contamination and potential correction if contamination is identified in harmful amounts.
The document is categorized into four chapters:
- USP <1788> Methods for Determination of Subvisible Particulate Matter
- <1788.1> Light Obscuration Method for the Determination of Subvisible Particulate Matter
- <1788.2> Membrane Microscope Method for the Determination of Subvisible Particulate Matter
- <1788.3> Flow Imaging Method for the Determination of Subvisible Particulate Matter
Three main techniques are outlined in each of the sub-sections of the guidance document. Light Obscuration (LO) continues to be the ideal first pass technique for the USP Normative chapters.
If a solution cannot be measured utilizing LO as a result of either viscosity or clarity (opacity, color), then the Microscope Method (MM) should be utilized. Flow Imaging (FI) is also practical for solving challenges with LO and has the extra advantage of fiber characterization.
Pharmaceutical injectable products are supplied in multiple forms. In each example, the component that is insoluble must be investigated in regard to contamination.
This presents challenges around testing and sampling techniques for the various forms (such as emulsions, solid drug suspensions and suspensions) and those with large molecular weight, which would influence the results from conventional LO tests.
Additives are also utilized in therapeutic products with adjuvant compounds to facilitate the active components, which are found at ≥ 2 µm and should be investigated.
A ≥ 50 µm limit for particulates is now a requirement for ophthalmic solutions and the selection of instruments must ensure that these sizes are available.
It is recommended to have a library or knowledge base of the potential identification of contaminants and their sources during the production of the products. When defining this library, no single method should be utilized as it is likely to not capture measurements that may be required during manufacture.
This investigation will also create the baseline of changing particle distribution or contamination levels for colleagues to react to. Methods like elemental analysis, electron microscopy and spectroscopy can create alternative data for particulates.
Applicability of Methods
The table below provides a comparison of the various types of inspection methods, along with the limitations of the applied methods.
Table 1. Comparison of Techniques. Source: Particle Measuring Systems
| TECHNIQUE |
USP CHAPTER(S) COMPENDIAL |
USP CHAPTER INFORMATIONAL |
SAMPLE VOLUME |
DETECTION RANGE |
METHOD LIMITATIONS |
| VISUAL |
<790> |
<1790> |
Filled container |
Approximately > 150 μm |
Subjective results
Particles of low contrast
Air bubbles |
| LIGHT OBSCURATION |
<788>
<789>
<787> |
<1788>
<1789> |
0.2 – 5 ml per sample |
≥ 2 μm
Typically ≥ 10 μm & ≥ 25 μm |
Immiscible liquids
Clean glassware
Very large particles
High concentrations
Particle shape / aspect |
| MICROSCOPE METHOD |
<788>
<789> |
<1788> |
0.1 – 100s per sample |
≥ 10 μm
Typically ≥ 10 μm & ≥ 25 μm |
Clean Glassware
Immiscible liquids
Gelatinous solids
Particle contrast |
| FLOW IMAGING |
<1788> |
<1788> |
0.1 – 1 ml per sample |
Typically ≥ 2 μm |
Cell contamination
Low contrast
Determination of size |
The figure below, provided in the standard, is copied here. It demonstrates the range of sizes for each measurement standard along with the clear gray zone boundary for tests.
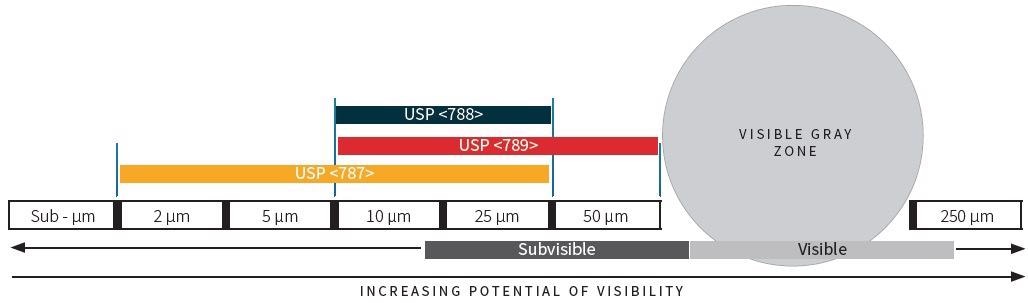
Figure 1. Comparison of Sizes and Testing Requirements. Image Credit: Particle Measuring Systems
Particle Count Limits
The limits for USP <788> Particulate Matter in Injections have not been altered since the mid-1990s and are determined at sizes ≥ 25 µm and ≥ 10 µm. This is a result of calculating the validity of the upper concentration limits for LO.
The ≥ 10 µm and ≥ 25 µm size ranges are also applied in the limits for USP <789> Particulate Matter in Ophthalmic Solutions, which also recently added the ≥ 50 µm size threshold. The limits are provided for the total quantity of particles per container volume for small volume injectable (SVI) containers (≤ 100 ml).
The standard smallest container was originally found to be 2 ml, which set the total particulate burden as per container. The total counts is per milliliter for large volume injectable (LVI) containers (> 100 ml), due to possibly higher doses being delivered for a longer duration.
Table 2. Comparison of Particle Concentration Limits. Source: Particle Measuring Systems
| TEST |
TECHNIQUE |
| LIGHT OBSCURATION (LO) |
MICROSCOPEMETHOD (MM) |
| ≥ 10 μm |
≥ 25 μm |
≥ 50 μm |
≥ 10 μm |
≥ 25 μm |
≥ 50 μm |
| <788> SVI ≤ 100 ml |
6000 / container |
600 / container |
-- |
3000 / container |
300 / container |
-- |
| <788> LVI > 100 ml |
25 / ml |
3 / ml |
-- |
12 / ml |
2 / ml |
-- |
| <789> |
50 / ml |
5 / ml |
2 / ml |
50 / ml |
5 / ml |
2 / ml |
NOTE:
a. The limits for <787> are added to be greater than both the ≥ 10 µm and ≥ 25 µm size requirements.
b. For FI data, no threshold has been determined and no restrictions are applied for data ≥ 2 µm.
c. For all data from all sizes inside the test threshold, sample records should be kept and an out of trend assessment should be conducted to establish if the process or product is within acceptable levels of control.
d. Thresholds are for the complete shelf life of a product and stability should not impact it.
The table above shows the extraction of a sample from a complete production population that is characteristic of the lot or batch. Traditionally, a single sample volume of ≥ 5 ml was used.
At that time, the available sampling methods for LO instrumentation were comparatively coarse and larger volumes of samples offered enhanced statistical accuracy in the result.
Significantly smaller single sample volumes can be utilized in modern instrumentation, which means the sampling strategy must better reflect production changes as potentially smaller volumes can be lost during measurement.
Test Method Influences
Calibration Considerations
Techniques and instruments must be validated and calibrated against traceable (NIST or additional certification bodies) count and size standard solutions.
When suitability or calibration test solutions are prepared, care must be taken to ensure aggregation of suspended particles is avoided and an even mixing has been achieved.
The complete range of measurements should be included in the calibration, and if necessary, further information proving its sizing adherence.
Validation Considerations
The test method in <788> has established a dependable quality parameter for several years against the injectable solutions that are mainly low viscosity and clean.
The phrase ‘water like’ is utilized in the standard. For those solutions that do not fit with the ‘water like’ description, further measurements may be needed along with an alternative approach created as part of the complete determination of the product and its particulate contaminants.
<1788.1> Light Obscuration Method for the Determination of Subvisible Particulate Matter reviews the specifics of the validation guidelines for a Light Obscuration instrument system.
There are further guidelines that are relevant to all the test techniques outlined individually in the further sections.
- Specificity. A method’s ability to establish variations between types of particles. MM and LO both provide low specificity, but a secondary evaluation can be performed using the captured particles on a filter substrate.
- Recovery. A challenge to show a method’s ability to identify particles of an alternative refractive index. This data enables a technique to be described outside of the standard test guidelines and added to the characterization library.
- Linearity and Range. Investigations to identify the system’s response at known concentrations up to the 10% coincidence limit of maximum concentration and inside the specified operating range which shows the linearity of the selected instruments. This data can be sourced from suppliers.
- Accuracy. Two variables exist in accuracy for particle counting. These are the particle concentration in suspension and the particle size. These variables along with others, for example, volume and flow rate, are investigated as part of the PQ/IQ/OQ.
- Precision. This is how repeatable the test is. This is shown as consistency in measurements either during qualification of the count standard test or in standard testing (such as mixing variability).
- Detection Limit. Reference is made to a system’s ability to identify an individual particle against the background of electronic noise and media composition.
- Robustness. The overall system’s ability to be sensitive to changes. MM is highly reliant on operator inputs.
Good Sampling Practices
The measurement of individual containers can be performed once a sufficient sample set has been selected from the general population. There are multiple techniques employed for sampling, and in each example, care should be taken to avoid contaminants being introduced to the investigated sample.
All sample testing and preparation must be conducted inside a controlled area to decrease the external impact of particles to the test, optimally under unidirectional, filtered air flow conditions.
Outside of the test area, all secondary packaging should be removed, and significant care must be taken regarding the cleanliness of any glassware where sample pooling is conducted.
The cleaning of glassware must produce results that do not strongly impact the general test results and optimally meet the ‘blank’ test guidelines.
The amount of product samples employed depends on the volume of the delivered sample. The following sampling techniques can be chosen by the user:
- Direct Sampling. Containers with a volume greater than 100 ml can be directly sampled from the container and the results can be contrasted to the per ml specifications. Sample volumes greater than 25 ml can be sampled individually from the container and average results can be calculated per container, in line with SVI criteria standards.
- Pooling. The container contents where the volume of the single sample is insufficient can be pooled by pouring the liquid directly into clean glassware and taking a sample from the pooled population.
- Reconstitution. Lyophilized products should be reconstituted in line with the prescribed technique for standard usage with either particle-free water or the supplied diluent. The samples must be reconstituted first and then pooled if it is required.
- Dilution. Where investigations utilizing FI or LO are conducted and the sample does not meet sample color, viscosity or volume guidelines for sufficient testing, then the sample can be diluted employing particle-free water. The dilution factor must be established and included in the results.
Sample mixing to ensure any sedimented particles are re-entrained into the solution must be performed through gentle tumbling, swirling or rotating.
Care should be taken to avoid exposure to further contaminants or bubbles, which may harm any sensitive elements of the suspension.
The efficiency of homogeny can be found in the uniformity of the test information. Techniques like vacuum, sonication, or standing can be employed to degas the sample.
<1778.1> Light Obscuration Method
The section <1788.1> of the master document <1788> outlines factors related to Light Obscuration (LO) tests and sample recommendations. As stated before, LO is the ideal main technique for the quantification of particulate matter in pharmaceutical technologies.
In LO, a laser is focused at a photodetector which is the key technology of this method. Particles then travel through a narrow capillary tube past the laser optics while being held in liquid suspension.
A shadow is cast across the photodetector while the particles transit the laser beam. The amplitude decay of light on the detector circuit relates equally to particle size. Calibration aligns the response of the detector and particle size throughout the instrument’s size range.
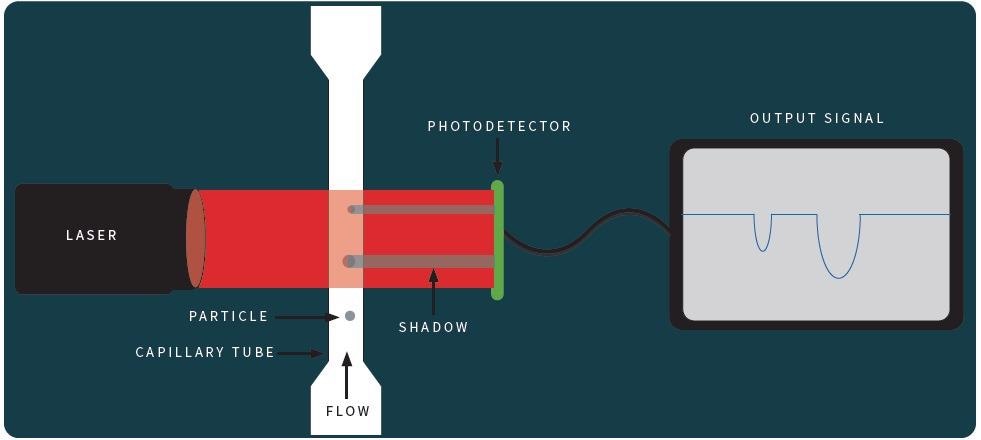
Figure 2. Schematic of Light Obscuration Principle. Image Credit: Particle Measuring Systems
Verification of Performance
Liquid particle counter systems, for example, the APSS-2000 are completely calibrated when supplied for the complete sensitivity range (2 µm to > 125 µm).
Calibration on a yearly schedule is suggested to ensure that there are no variations in the main measurements and that no optic contamination has arisen, which may affect accuracy.
Further investigations to validate the complete range of variables is also necessary and forms the verification of an installed system.
As part of USP<1788.1>, the following assessments are suggested:
- Sample Volume Accuracy. This confirms the precision of the quantified sample volume. The investigation utilizes particle-free water in a container. The reduction in weight between each extraction is equivalent to the determined amount of removed water.
- Sample Flow Rate. A fixed flow rate is used to calibrate the particle counter. The APSS can facilitate multiple flow rates, but each system has a specialized calibration curve that must be configured using the software provided.
The validation of flow rate is conducted by timing the cycling of the syringe sampler with a determined sample volume. Time divided by the sample volume equals the flow rate.
- Diameter Calibration. NIST traceable spheres are utilized to conduct the calibration. The particle size is aligned to the signal inside the sizing circuits using an internal algorithm. The APSS 2000 is compliant with the “Automated Method” for the calibration of instrumentation.
- Sensor Size Resolution. This investigation shows the ability of the particle counter to distinguish between particles of various sizes and ensures that the signal distribution does not impact an adjacent size.
A solution of 10 µm particles is utilized and the ratio of counts between channels is established. The APSS 2000 adheres to the “Automated Method” for the resolution of instruments.
- Particle Counting Accuracy. A regular solution of known concentration and size is measured for the number of particles per unit volume. The results are validated against the specifications on the traceable standard provided.
What is Next?
There are multiple factors for pharmaceutical manufacturers to consider considering the new USP <1788>.
Ask the experts from Particle Measuring Systems to assist in aligning a business with the latest regulatory guidance. The APSS-2000 testing system from Particle Measuring Systems fully adheres to the requirements for use in the testing of solutions in the Normative Chapters:
- <788> Particulate Matter in Injections,
- <789> Particulate Matter in Ophthalmic Solutions and
- <787> Sub-visible Particulate Matter in Therapeutic Protein Injections
The system also adheres to the specifications in the General Chapters:
- <1788> Methods for Determination of Subvisible Particulate Matter
- <1788.1> Light Obscuration Method for the Determination of Subvisible Particulate Matter
Acknowledgments
Produced from materials originally authored by Mark Hallworth from Particle Measuring Systems.

This information has been sourced, reviewed and adapted from materials provided by Particle Measuring Systems.
For more information on this source, please visit Particle Measuring Systems.