Standard environmental monitoring with a cart of equipment that collects samples at pre-established locations of the cleanroom is a process that many have grown accustomed to performing.
These microbial burdens and particle counts are collected with dynamic air-samplers, settle plates and portable particle counters where surface samples are taken to comply with gowning procedures.
Based on recommendations from industry,1 this process frequently occurs on a basis varying from every day, monthly, on each shift, or once a week according to the associated criticality to the end product.
Conditions are approved inside controlled areas like cleanrooms by using the results collected from these ‘spot reading’ schedules, where each individual sample must be:
- As representative and precise as possible
- Appropriate to ensure that controls are being upheld
- As statistically significant as the conditions of the environment allow
Regulations need a continuous monitoring system for particles in the most crucial areas before manufacturing and throughout production, representing a better degree of control over the environment.
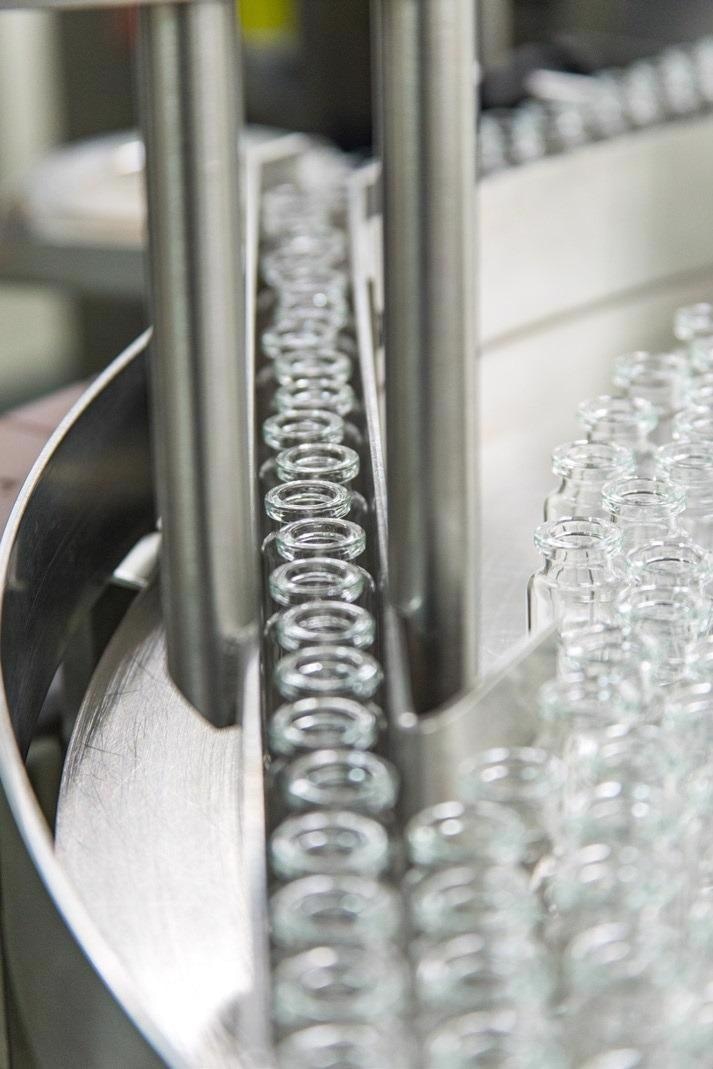
Figure 1. Critical point in cleanroom environment. Image Credit: Particle Measuring Systems
This shift to continuous monitoring can provide a large quantity of data. For example, instead of utilizing a portable instrument to acquire three one-minute samples at each defined and selected location, data is now a continual funnel flowing from the sensor to a main monitoring system.
In turn, this constantly enables the degree of control to be measured and demonstrates any variance between ‘anomalous’ and “normal” environments.
Where control was historically required to be demonstrated through discrete sample information, control is now the presumed state, and out of tolerance (OOT) events become the discrete event that must be investigated.
This article outlines current good manufacturing practices (cGMPs) and how they can be used in a continuous monitoring system configured inside a facility.
This procedure should allow production and quality personnel to determine novel monitoring understandings and align with the guidelines. This review will evaluate the set-up of action and alert levels and possible reactions, along with the reporting needs of these systems.
Current Requirements in Industry
Evaluating the historical alterations to GMP that determine the modern expectations and understanding of environmental monitoring (EM) in controlled areas is required to inform the chosen approach.
The purpose of the EM program is to document the state of control of the facility, not to determine the quality of the finished product.
Scott Sutton, PH. D – Author and Speaker for the Pharmaceutical Industry.
A shared standard is used to classify cleanrooms. A new metric standard, ISO 14644-1:1999, replaced the Federal Standard 209E:1992 (FS209E) in 1999. On November 29th, 2001, the United States changed to the ISO 14644-1 from FS209E.
At this stage, cleanrooms were no longer categorized by their FS209E number (Class 100, Class 10000, etc.) and instead were classed by their metric classification number (ISO 7, ISO 5, etc.), and the monitoring guidelines also became metrified.
Regardless of the actual volume of samples taken, data to uphold the new standard must be normalized and presented as counts per cubic meter (n/m3). The EU GMP Annex 1 was also updated with the release of a new ISO 14644 classification guideline.
An updated version of Annex 1 was published in 2003 to reflect the changes to ISO 14644. The following statement was released on the front cover:
“The guidance has been reviewed in the light of the international standard EN/ISO 14644-1 and amended in the interests of harmonization but taking into account specific concerns unique to the production of sterile medicinal products.”
There were several points to note. Annex 1 has been updated in line with the industrial certification standard ISO 14644-1, sterile medicinal products and further concerns that apply to more sterile, critical locations. An updated table of necessary limits was also prescribed:
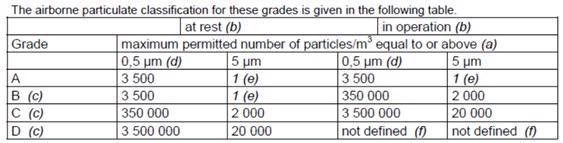
Figure 2. New Annex 1 particle cleanliness limits. Image Credit: Particle Measuring Systems
Prior to the 2003 publication, the limit for 5.0 µm was zero because of the connection between macroparticles (> 5.0 µm) and the possibility of microbial activity creating colony-producing units.
Separate microbes either utilize biomass, moisture or dust in order to balance desiccation. They are also able to break off as bigger components from operators.
When following the ISO 14644-1 guideline for sample volume, the original zero is a technical impossibility, so the number had to be the lowest possible integer to enable the formula to function.
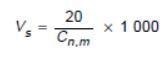
Figure 3. Formula in ISO 14644-1:1999, Section B.4.2 establishment of single sample volume per location. Image Credit: Particle Measuring Systems
This results in a 20 m3 sample volume. This type of result is not viable for the categorization of cleanrooms, as a lot of time is needed to meet the specification. Figure 2 shows the footnotes listed below the table in Annex 1, where this was explained.
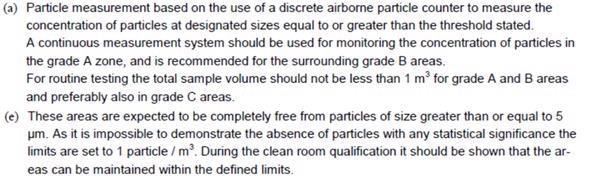
Figure 4. EU GMP Annex 1 2003, table 1, footnotes (A) and (E). Image Credit: Particle Measuring Systems
Note (a) can be divided into the following instructions:
1. Utilize a particle counter.
2. A continuous measuring system should be used to monitor Grade A.
3. A 1 m3 sample should be taken for standard classification (testing) applications.
The zero had to be removed to adhere to the ISO 14644-1 statistical guidelines in real terms, but essentially no particles should be found that are larger than 5.0 µm.
Many misinterpreted the notes to state, “use a particle counter and sample 1 m3 for routine monitoring”, which is inaccurate. This resulted in misunderstanding and was made clear with an updated classification table with the publishing of EU GMP Annex 1, being enforced in 2009:
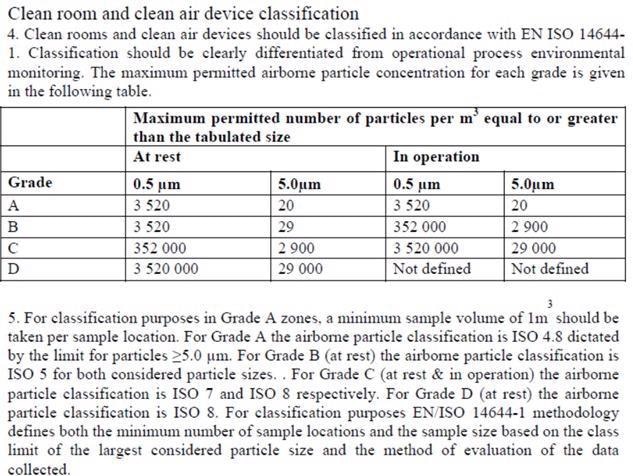
Figure 5. EU GMP Annex 1 2008, #4 and 5. Image Credit: Particle Measuring Systems
This update enabled the result of the formula to adhere to the 1 m3 sample for classification. It additionally explained its application as only for classification, influencing the adoption of an ISO Class 4.8 for Grade A.
Paragraph 4 explains that operational process environmental monitoring and classification must be clearly differentiated. In the 2008 update, there is guidance on the alert and action limits.
Observing paragraph 20, this reviews the modern risk assessment protocols that explain the process conditions should determine the thresholds:

Figure 6. EU GMP Annex 1 2008 text, #20. Image Credit: Particle Measuring Systems
Thresholds determined by room classification are those that are relevant to identify control over possible risk, established upon room dynamics like the activity type, type of product, number of colleagues, among others.
Due to small-number statistics, these limits are based on frequency in adherence to USP <1> and USP <1116> where trend analysis is explained to be a more accurate reflection of control than absolute numbers with contentious statistical significance.
The following instruction is given in paragraph 13 of the Annex 1:
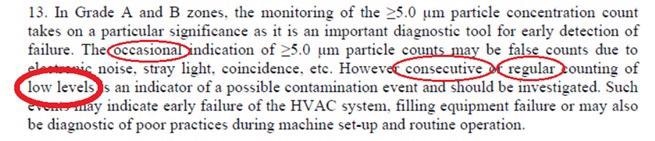
Figure 7. EU GMP Annex 1 2008 text, #13. Image Credit: Particle Measuring Systems
When evaluating an action and alert strategy and its application to environmental control and particle counting, the risk must determine what is regarded as consecutive or regular versus occasional.
In all examples, the limit is not given as 1 count/m3 or 20 counts/m3 but as a “low level,” which can only be determined by a particular room, process operation, or location.
Proposed 2021 Revision to EU GMP Annex 1
The latest update of EU GMP Annex 1 is currently being evaluated, and this will be published soon. It reflects the update to ISO 14644-1:2015 where the 5.0 µm limit for ISO 5 classified locations was removed as a result of the statistical significance of larger sized particles.
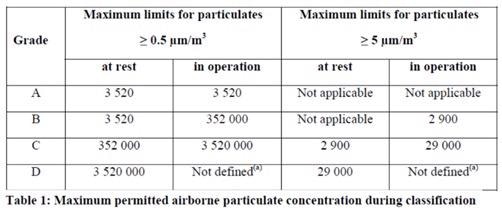
Figure 8. 2021 Annex 1 text, table 1. Image Credit: Particle Measuring Systems
Monitoring for both microbial and total particle contaminants has been moved to section 9, and classification is now section 4, differentiating the approach needed for each activity.
A Contamination Control Strategy (CCS) is now recommended for monitoring, which takes a holistic view of the procedure of developing controlled spaces, including gowning, HVAC, data evaluation and monitoring them utilizing specified methods. It explains:
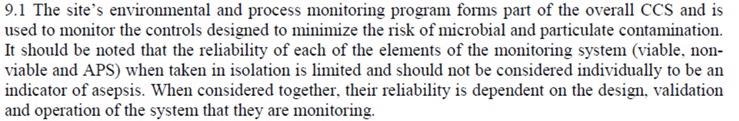
Figure 9. 2021 Annex 1 text, #15. Image Credit: Particle Measuring Systems
Action limit and alert specifications are replicated from the 2008 update and explained. They do not define the number that constitutes an actionable limit or explain a number that determines periodic events. This is reported instead with the CCS and the Risk Assessment.
Figure 10. 2021 Annex 1 text, #15. Image Credit: Particle Measuring Systems
Monitoring protocols should establish the approach to trending. Trends can cover, but are not limited to:
- Consecutive breaches of alert levels
- Regular or frequent individual breaches of action limits that could have a shared cause
- Increasing numbers of alert or action level breaches
Reporting
System reports should be included as a component of the CCS. As mentioned before, a room evaluated employing a portable device generates information that must reflect that control was upheld.
Due to this, the information must be ‘absolute’ and presented in all reports. The change to a continuous monitoring system now frequently shows compliance with control measurements (determined by action and alert levels), and only examples where control is lost must be evaluated.
General audit trails and trend reports show when the system was out of control and any counter actions taken as part of the SOP.
System reports must concentrate on:
1. Which sensors are included, the report boundary, the time frame that the report includes and any further batch data that uniquely describes this period.
2. The alert and action threshold excursions, audit trail, user login, remedial actions, system changes, start and end time data, among others.
3. The trend report as a means of presenting the data as a simple to read trend plot (graph) image, showing that no data had been lost.
4. Where an action level has been exceeded, or any out of tolerance event has arisen. This time frame can be communicated by an exception report to prove that before the event, everything was running as standard, and was restored to normal conditions after the event.
Application of Strategy
Action and alert thresholds can be applied to show a trending condition called an N:M, where the number of events (N) is inside a population of events (M).
As an example, an N:M of 2:6 would describe a rolling group of numbers where any 2 samples out of a total of any 6 samples would need an action, with the first trigger timing the clock to evaluate the next 6 samples for an additional triggering event. The counter is reset until the next activation event if none are identified.
The system alerts are changed to non-actionable events, where the trigger is only employed to evaluate data when utilizing this application.
The non-actionable events enable comparison between equivalent time periods (such as quarters, months, weeks) or events (such as lot, filling, or batch) to ensure the system does not negatively trend over longer periods of time.
This makes sure that the limits allocated in the system are dependable alerts of negative conditions and show a loss of control over the site in relation to the quality of products.
The particle levels are determined with each of the following:
1. Alert – An alert event is triggered if any value reaches higher than the ‘normal’ operating condition values when normalized to cubic meters (x35).
Operating protocols should outline assessment and follow-up if alert levels are exceeded, which covers consideration of an assessment and/or corrective measures to limit any additional damage to the environment. This event is essentially non-actionable.
- Data is periodically evaluated for negative trending and can be compared against the room production events to confirm that where possible contamination may arise, future updates can show the changes needed.
2. Alarm – The frequency (N:M) is set so that an individual location must be in ALERT for a specified frequency before generating an alarm event, through an audit trail, siren, or beacon, among others.
When these events happen, operating protocols should offer a root cause evaluation, an investigation of the possible impact to product and requirements for preventative and corrective measures. This is a condition that is out of control.
Alert and Action Level Setting
It follows then that the level utilized to catalyze requirements should be identified. The following techniques are described in the guidance from the PDA technical report 13:
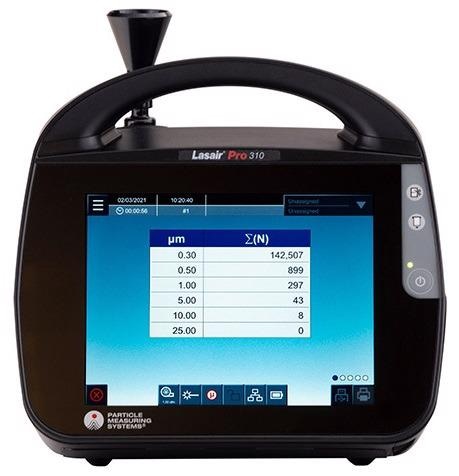
Figure 11. Lasair® Pro aerosol particle counter - a modern particle monitoring tool. Image Credit: Particle Measuring Systems
- Cutoff Value – A 99% or 95% control limit established using information previously collected from a collection of similar locations or a single location.
- Normal Distribution – The standard deviation and mean of a data set, where high counts can be seen. Skewed data sets may arise, and non-parametric rules apply where there is a predominance of zeros.
- Non-parametric Tolerance – A measure to statistically determine that a room is compliant with a minimum of 95% confidence.
Each sample site or group of sample sites that demonstrate equivalent properties must have a data review. The process of normalization is less to do with understanding process controls and more to do with putting the data into an SI unit as stated in the protocols.
As an example, pressure can be employed as either millibar (mBar), pascals (Pa) or inches of water gauge (H2O), but due to scaling, each parameter has a unique numeric value.
Data per minute provides a balance between testing at a sufficiently short interval for response rate while offering sufficient sample volume (presuming a 28.3 LPM flow rate) and as such the statistical confidence and related potential counts in the data.
The extremes of each period of time can also be evaluated. Sample durations that are long (35.3 minutes) will offer strong statistical confidence in the information, but very short sample periods (5 second intervals) and poor reaction to control conditions will offer better dynamic responses.
If the data is low confidence, this is where the few counts produced need several records to provide statistical knowledge and returns back to poor responses. Due to this, the raw information from the instrument can be utilized, expressed as counts per cubic foot or counts per minute.
The market has found it more helpful to express the standard in counts per cubic meter (n/m3). Irrespective of the units selected to show the level at which an out-of-tolerance event happens, the number of particles that influence the event and the regularity with which an event is escalated to actions must be identified.
References and Further Reading
- PDA Technical Report 13, Fundamentals of an Environmental Monitoring Program, 2016.
- FEDERAL STANDARD FED-STD-209E. September 11, 1999.
- International Standards Organization. ISO 14644-1. Cleanrooms and associated controlled environments – Part 1: Classification of air cleanliness. 1999.
- EudraLex. The Rules Governing Medicinal Products in the European Union Volume 4. EU Guidelines to Good Manufacturing Practice Medicinal Products for Human and Veterinary Use Annex 1 Manufacture of Sterile Medicinal Products. 2003.
- Volume 4 EU Guidelines to Good Manufacturing Practice Medicinal Products for Human and Veterinary Use Annex 1 Manufacture of Sterile Medicinal Products 2008
Acknowledgments
Produced from materials originally authored by Mark Hallworth from Particle Measuring Systems.

This information has been sourced, reviewed and adapted from materials provided by Particle Measuring Systems.
For more information on this source, please visit Particle Measuring Systems.