Until recently, X-Ray Energy Dispersive Spectroscopy (EDS) was used to perform very basic analysis of biological samples. Analysis often needed beam currents beyond the acceptable level and nanostructure mapping was a difficult task to achieve because of sample drift and the beam damage caused by prolonged exposure. The advent of the Ultim® Extreme has greatly improved biological analysis by optimizing count rates even at low accelerating voltages and small spot sizes.
Limitations of Conventional Techniques
Biological structures are particularly vulnerable to electron beam damage because their main constituents are light organic materials. For maintaining sample structure and quality, biological SEM analysis is performed on sections of cryogenically frozen material and a low accelerating voltage is applied to minimize beam damage. In addition, beam exposure is kept to short duration.
The use of a low kV for EDS analysis will limit the range of elements of interest and the use of conventional 10mm2 detectors can provide count rates of only a few hundred counts per second (cps). This leads to long analysis times to acquire adequate counts to be statistically significant. Traditionally, EDS mapping was a challenging task due to reduction in data integrity caused by sample drifting.
Key Features of Large Area SDD Detectors
The prospect of EDS analysis for beam sensitive and cryogenically frozen samples has been greatly improved by the launch of large area SDD detectors with outstanding light element performance. The Ultim® Extreme range of detectors provide sensor sizes between 20 and 80mm2. A new very large active area sensor size of 150mm2 is also available. Counts from samples can be optimized with these large active areas even at low kV and small spot sizes, thereby making rapid analysis and accurate mapping on biological samples practically possible.
EDS Analysis with Large Area SDD Detectors
The results from a wheat sample analysis by a single detector are shown here. After embedding the seed into a Spurr type resin, it was stained with Osmium to highlight the fatty acids. Then, the EDS analysis of the aleurone cell layer was performed. The EDS maps were collected at 5 kV with a single Ultim® Extreme detector on a TESCAN Mira FEGSEM at an acquisition time of 30 minutes.
The results are outstanding. The resultant maps are bright with full of counts and without sample drift in spite of the relatively long collection time. Osmium (Figure 1b) and Phosphorus (Figure 1c) are easily determined and clearly separated. A unique structure is depicted in the Nitrogen map (Figure 1d). The differing elemental distributions found in the sample can be clearly observed from the single layered image (Figure 1e) obtained by integrating all three maps.
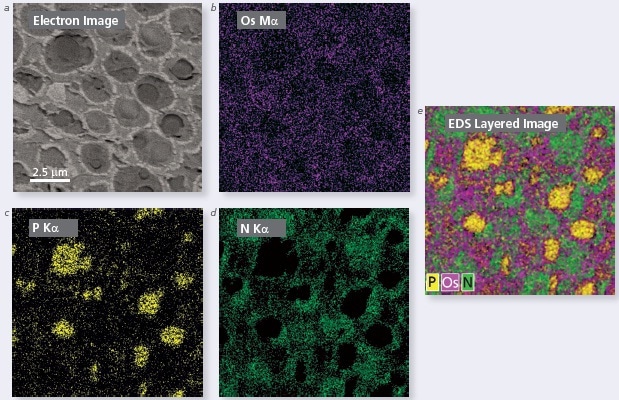
Figure 1. (a) Electron micrograph showing the microstructure of a wheat seed aleurone cell. EDS maps of (b) Os Mα, (b) P Kα and (d) N Kα. (e) Layered image combining all 3 maps.
Conclusion
The high sensitivity and large active area provided by the new generation of Ultim® Extreme detector delivers biological analysts with a rapid non-destructive analysis technique. Additionally, microscope and laboratory-based analysis methods can be dramatically improved by X-ray maps. The very large active area facilitates users to perform cryogenic sample analysis rapidly and precisely with lower kV, small spot sizes, and higher count rates. This reduces sample drift, contamination and beam damage.

This information has been sourced, reviewed and adapted from materials provided by Oxford Instruments Nanoanalysis.
For more information on this source, please visit Oxford Instruments Nanoanalysis.