During the last twenty years, biomedical research around the world has been significantly increasing its efforts to develop drugs based on nanoparticles and commercialize them. Today several high-potent molecule-based drugs are used in suboptimal conditions such as low dosage due to their toxicity or minimal efficiency in the cell types and targeting of specific organs.
Recent discoveries have proved that nanoparticles such as liposomes or polymers have very good properties as drug delivery vehicles to address these issues. When a nanoparticle-based drug is considered, it is crucial to characterize the vector size as it has a significant effect on pharmacokinetics or their ability and efficiency to reach their target in the body. It is also equally important to understand the concentration nano-objects and the dosage of nano-objects loaded with the desired drug.
This article describes how nanoparticle tracking analysis is used for concentration and size measurements of drug delivery nanoparticles. Furthermore, by using a drug molecule, which is fluorescently tagged, one can determine the number of drug delivery nanoparticles, which have been loaded successfully with drug molecules.
Nanoparticle Tracking Analysis (NTA) Overview
NTA uses the properties of both Brownian motion and light scattering for obtaining the particle size distribution of samples in a liquid suspension. A laser beam is passed through the sample chamber and the particles in suspension in the beam path scatter light such that they can be seen easily through a 20x magnification microscope onto which a camera is mounted. The camera, operating at 30fps captures a video of the particles moving in Brownian motion in the field of view of approximately 100 µm x 80 µm x 10 µm (Figure 1).
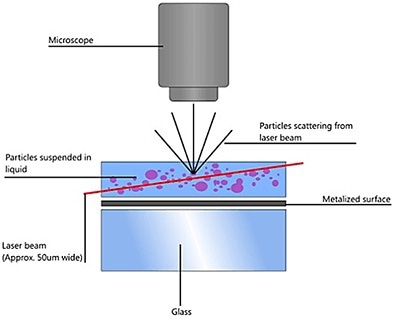
Figure 1. Schematic of the optical configuration used in NTA.
The particle movement is captured on a frame-by-frame basis. The proprietary NTA software identifies and tracks simultaneously the centre of each of the observed particles, and obtains the average distance moved in the x and y planes. This value helps determine the particle diffusion coefficient (Dt) from which by knowing the sample temperature T and the solvent viscosity η, the spehere-equivalent hydrodynamic diameter d of the particles are determined with the Stokes-Einstein equation (Equation 1).
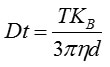
where KB is Boltzmann's constant.
NTA is not an ensemble technique concerning a large number of particles, but each particle in independently sized irrespective of the others. Figure 2 shows an example of the size distribution profile generated by NTA.
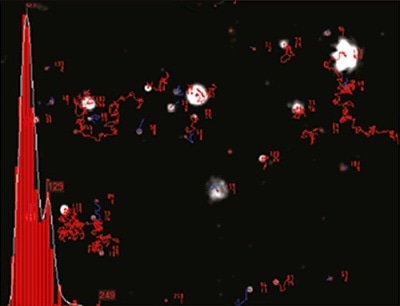
Figure 2. An example of the size distribution profile generated by NTA. The modal size for this sample is found to be approximately 70 nm, with larger sized particles also present.
Furthermore, the movement of particles is determined within a fixed field of view (approximately 100µm by 80µm) illuminated by a beam approximately 10µm in depth. These figures help estimate the scattering volume of the sample by determining particle concentration in this field of view and extrapolating the same to a larger volume, one can achieve an estimation of concentration in terms of particles per mL for any given size class or an overall total. Finally differentiation of suitable labeled particles is possible in a fluorescence mode.
Materials and Methods
Equipment: A NanoSight LM10 HSBF system was used, comprised of a sCMOS camera, 405 nm laser and 430 nm long-pass filter. Analysis was performed using NTA software 2.3.5.
Materials: Polylactic Acid (PLA) particles (Adjuvatis) were designed, synthesized and loaded with a drug of interest conjugated to a fluorescent label (Coumarin6, Excitation 370 nm; Emission 470 mm) (PLA-Coum).
Method: PLA-coum nanoparticles were diluted 100-fold with particle-free ultra-pure water* and mixed by pipetting.* The water was checked by NTA before use and found to be free of contaminant particles.
A 1mL silicon-oil free syringe was used to load the diluted sample into the laser sample chamber. The sample chamber was loaded to the instrument. The adjustment of the image was done to focus the particles and a video was captured at camera level 7 for 60s to generate data for light-scatter (standard) mode (all particles in the sample measured). The camera level was then increased to level 16 and after inserting the 430nm long-pass filter, another 60s video was captured and refocused to obtain fluorescence-mode data. Processing of the videos was then done with a detection threshold of 4 for both scatter mode and for fluorescent mode. For both fluorescence and scatter modes, the minimum track length was set at 6. For both the measurement modes, size distribution data was obtained and overlaid for comparison.
Results and Discussion
As a result of the sample production technique, a mixture of non-labelled and labelled PLA particles were expected. NTA data for both the particles under a scatter mode as in Figure 3 and a fluorescence mode as in Figure 4 were obtained. A diffusion coefficient was generated by moving the particle from frame to frame of the video and consequently the size of the particle (Figure 3b and Figure 4b), while the average number of particles in each frame of the video was used to give an estimation of sample concentration (Figure 3a and Figure 4a). From these parameters a size distribution profile graph was generated for each measurement mode (Figure 3c and Figure 4c). Summary data for size and concentration are shown in Table 1 and Table 2.
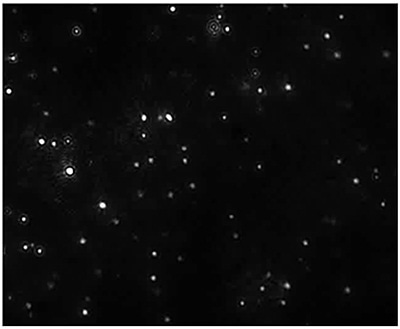
Figure 3a. Measurement of the size and concentration under scatter mode. (all particles)
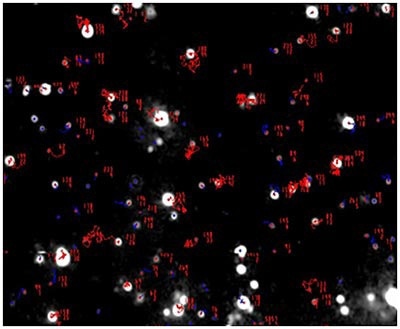
Figure 3b
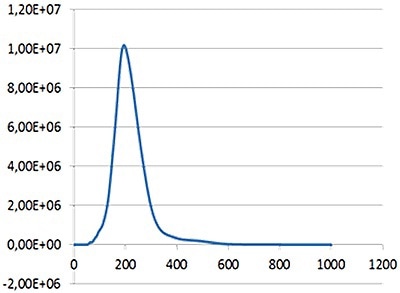
Figure 3c
| Mean |
: |
214 nm |
| Mode |
: |
199 nm |
| Measured concentration |
: |
1.23 x 10⁹ particles/mL |
| Dilution factor |
: |
100 times |
| Final concentration |
: |
1.23 x 10¹¹ particles/mL |
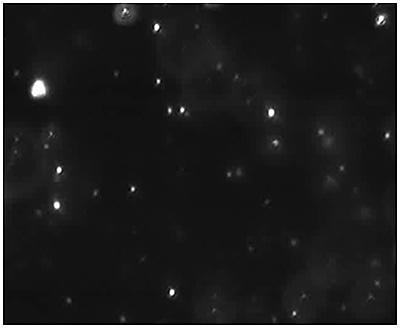
Figure 4a. Measurement of the size and concentration under fluorescence mode (drug containing particles) with the use of a 430 nm long-pass filter.
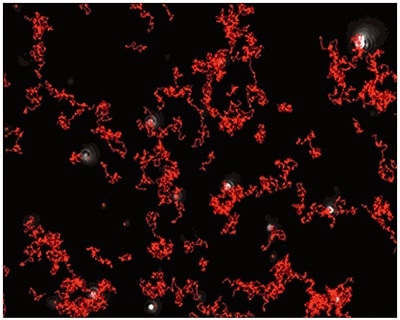
Figure 4b
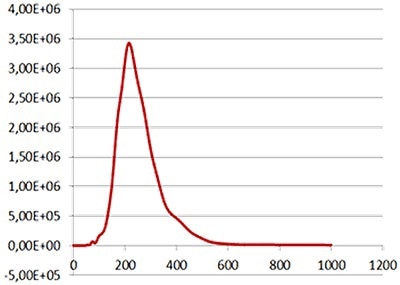
Figure 4c
| Mean |
259 nm |
| Mode |
223 nm |
| Measured concentration |
5.31 x 10⁸ particles/mL |
| Dilution factor |
100 times |
| Final concentration |
5.31 x 10¹⁰ particles/mL |
Fig 4a shows the sample viewed under fluorescence mode. With the sample measured through the 430 nm long-pass filter, only the labeled particles are tracked (Fig.4b). Particle size is obtained from the diffusion coefficient using the Stokes-Einstein equation, particle size is derived from the Diffusion Coefficient obtained from the Brownian motion of the particles. Summary size and concentration data are shown in Table 2. Under scatter mode (no filter), the analysis of the sample (Figure 5 blue line), shows a modal distribution at 199nm with a final concentration of 1.23e+11 particles/mL. Under fluorescence mode (430nm long-pass filter inserted), the distribution of the labelled population (Fig 3 red line) shows a slightly bigger mode at 223 nm with a final concentration of 5.31e+10 particles/mL. The widths of the distributions were similar. The sample was also shown to be monodispersed as no subsequent peaks were identified. In Figure 5, overlay of the size distribution profiles for PLA-coum nanoparticles in scatter mode is shown by the blue line and fluorescent mode is shown by the red line (x axis = diameter nm), y axis =concentration (particles per mL)
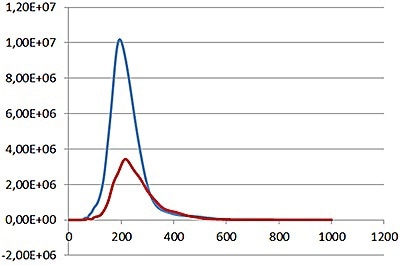
Figure 5. Comparison of labelled (red line) and non labelled (blue line) particle concentrations.
Conclusion
NanoSight NTA measurements allow a rapid evaluation of the size and concentration of polylactic acid nanoparticles. On loading with fluorescently labeled drug molecules, the subpopulation of particles which has a fluorophore can be distinguished from the total population offering important information on the efficiency of the loading process.
One can use this data to detect improved loading processes in a quick and convenient manner saving time and effort for drug delivery researchers.
- NanoSight offers an appealing alternative to more complex methods such as electron microscopy
- Fluorescence detection mode brings offers additional functionality permitting data on suitably labelled subpopulations of nanoparticles to be measured
- Minimal sample preparation required
- Real time capture offers high resolution size distributions and concentration measurements, showing both qualitative and quantititative data with the additional benefit of direct visual confirmation

This information has been sourced, reviewed and adapted from materials provided by Malvern Panalytical.
For more information please visit Malvern Panalytical.