The requirement for nanoparticle characterization is growing with development in the nanotechnology field and the increased use of nanoparticles in various processes and products. Nanoparticles are supplied in various compositions based on their applications, with silica dioxide (SiO2) nanoparticles being utilized in various fields, including semiconductor processes, strengthening of materials, paint, and much more. It is necessary to characterize the size and size distribution of the SiO2 particles to successfully implement and incorporate them into products.
A number of techniques have traditionally been used for nanoparticle-size analysis, including field flow fractionation (FFF), microscopy, light scattering, and small angle x-ray scattering (SAXS). While each has its own advantages and disadvantages, low sample throughput is their common limitation, which makes them incapable to characterize particles in large numbers. Data regarding individual particle composition and direct particle counting cannot be obtained using the aforementioned methods, except microscopy.
The development of single particle ICP-MS (SP-ICP-MS) has overcome the above mentioned limitations. Nanoparticles can be rapidly analyzed using this technique. Not only can thousands of particles be measured within a minute, individual particle information on size, size distribution, concentration of particles, dissolved concentration of elements and agglomeration can also be obtained using this technique.
The presence of 14N2+ and 12C16O+ poses challenge in silica measurement using ICP-MS as they have m/z same as the abundantly available Si isotope (28Si≈ 92% abundance) and form in the plasma. The background is very high at m/z 28, which makes it difficult to measure SiO2 nanoparticles by inhibiting low-level Si determination. Nevertheless, the background signal decreases with reducing measurement time due to the accumulation of fewer counts during an individual dwell time, but the count of ions generated from particle ionization remains constant.
Therefore the ions are determined over more time slices, and as a result the particle size detection limit should be improved for analytes suffering from elevated background, such as Fe, Se, SiO2, and more, by shorter dwell time. This article demonstrates the detection, measurement, and characterization of SiO2 nanoparticles with SP-ICP-MS, using dwell times below 25 µs.
Experiment
Sample Preparation
nanoComposix™ supplied known SiO2 nanoparticle standards of different sizes. The samples were prepared by subjecting the solutions for a 10 min sonication so that any agglomerated particles were loosened up, and they were then diluted with deionized water to obtain final concentrations of 100,000 – 200,000 particles/mL. The resulting solutions were subjected to sonication again before analysis. A 1000 mg/L dissolved silica standard was serially diluted to make dissolved calibration curves. For the dissolved standards, the silica concentrations were 2, 5, 10, and 20 µg/L of Si. SiO2 nanoparticle standards (180, 200 nm) at concentrations of roughly 100,000 particles/mL were used to create particle calibration curves.
Analysis and Instrumentation
A PerkinElmer NexION® 350D ICP-MS running in standard mode was used to perform all analysis, utilizing the Nano Application Module within Syngistix™ for the ICP-MS software. Table 1 lists the instrumental parameters, which were optimized to provide the highest Si signal without compromising the lowest background possible due to silica leaching from the torch.
Table 1. NexION 350D ICP-MS Instrumental Parameters.
| Parameter |
Value |
| Sample Uptake Rate |
0.33 mL/min |
| Nebulizer |
Glass Concentric |
| Spray Chamber |
Baffled Glass Cyclonic |
| RF Power |
1000 W |
| Analyte |
Si+ at m/z 28 |
| Mode |
Standard |
| Analysis Time |
60 seconds per sample |
Results and Discussion
The high background at m/z 28 caused by CO+ and N2+ makes the ICP-MS analysis of Si difficult. The SP-ICP-MS analysis involves the use of very short dwell times and monitoring counts instead of counts per second. SP-ICP-MS analysis have much lower backgrounds than traditional ICP-MS analysis. The background at m/z 28 when performing deionized water measurement with SP-ICP-MS in standard mode is shown in Figure 1. While measuring with a dwell time of 100 µs, the background in the SP-ICP-MS analysis is only 15 counts, a value much lower than that would be observed in traditional ICP-MS analysis. This low background allows the detection of SiO2 nanoparticles as the Si signal generated from the SiO2 nanoparticle ionization must be higher than 15 counts, based on earlier work with other metallic-oxide nanoparticles.
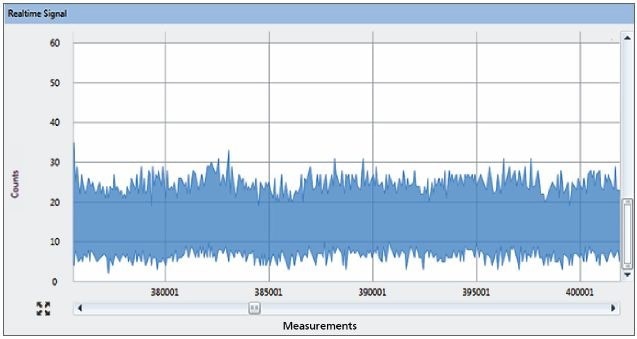
Figure 1. Unprocessed signal of deionized water at m/z 28 with a dwell time of 100µs using SP-ICP-MS in Standard mode.
The unprocessed signal obtained from 200 nm SiO2 particles is shown in Figure 2, because while measuring counts, shorter dwell times will lead to lower backgrounds despite lower analyte intensity. The impact of dwell time on the signal-to-background (S/B) ratio at m/z 28 is presented in Table 2 for a 10 ppb dissolved silica standard and deionized water. The significance of applying short dwell times can be understood from this data. The S/B ratio is below 1 with a dwell time (50 ms) typically employed for aqueous analysis. The S/B ratio is more than 1 when the dwell time is = 100 µs, showing the significance of using short dwell times for the analysis of nanoparticles.
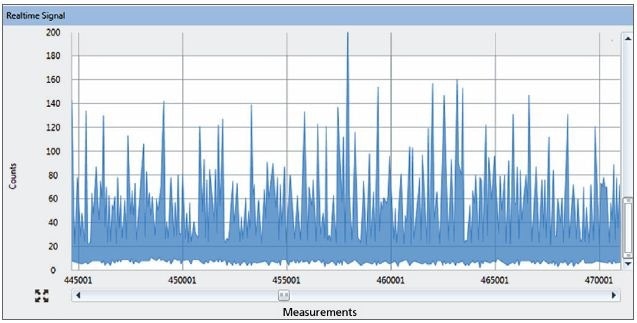
Figure 2. Unprocessed signal of 200 nm SiO2 particles deionized water at m/z 28 with a dwell time of 100 µs using SP-ICP-MS in Standard mode.
Table 2. Effect of Dwell Time on Si Signal to Background (S/B) at m/z 28
| Dwell Time (µs) |
Background (counts) |
10 ppb Si (counts) |
S/B |
| 50,000 |
20,000 |
10,000 |
0.5 |
| 100 |
21 |
42 |
2.0 |
| 50 |
10 |
21 |
2.1 |
| 25 |
5 |
10 |
2.0 |
The Si sensitivity is lower with decreasing dwell time but the S/B ratio remains constant, indicating the possibility of detecting smaller SiO2 particles in deionized water using shorter dwell times. Each spike characterizes the signal from a SiO2 particle, implying the easy observation of 200 nm SiO2 particles using SP-ICP-MS in standard mode. From the results, the mean particle size is found to be 208 nm, which is in good agreement with the size on the certificate (198.5 ± 10.5 nm, as measured by transmission electron microscopy).
This deduction is based on the fact that background signals are lower because of shorter dwell time, but there is no change in the individual particle mass and therefore, ionization in the plasma forms constant number of ions, but not as a function of the dwell time upon application of the surface area integration. A representation of this idea is presented in Figure 3, where each vertical line signifies a time slice, and the red dots with the plus signs indicate the ions. The count of ions determined in each time slice is illustrated below each time slice. The ions generated from a single nanoparticle are presented by the circled clusters of ions, while the background is represented by other ions. Each slice is assumed to be representation of a dwell time of 600µs in Figure 3a. Three particles are identified with each generating 16 ions over 4800µs, (8 dwells of 600µs each). The average background signal is found to be 6 ions, for an S/B ratio of 2.67. The arrival of particles in the plasma is at random times, the ion cloud of the particles is not always completely captured in a single dwell time window when the dwell time used is more than the particle transit time.
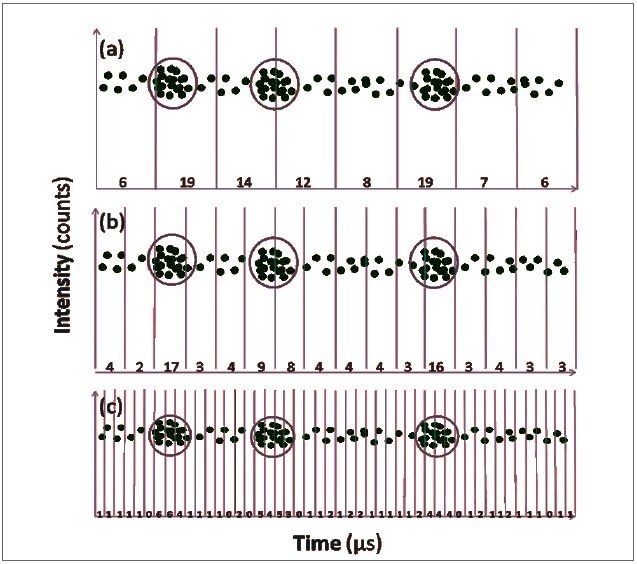
Figure 3. Representation of the effect of dwell time on particle and background detection. Dwell times: (a) 600µs; (b) 300µs; (c) 100µs. Each red dot represents an ion. The circled dots represent the ions from a single nanoparticle (3 particles detected in each representation); other dots represent the background signal.
Each slice indicates a dwell time of 300µs (Figure 3b), leading to 16 dwell times over the same time window of 4800µs. The count of background ions becomes half due to the shorter time, which is 3 ions on an average per dwell time, but the number of ions from every particle is constant (i.e., 16). The count of ions from every particle may be spread out over two dwell times, i.e., 13 ions on an average per dwell time because of the shorter dwell time. The ensuing S/B ratio is 4.3, more than with the dwell time of 600µs. The dwell time is shortened to 100µs (Figure 3c), implying that 48 measurements are there over the same 4800µs time window. This timing represents that the average background signal decreases to one ion per dwell time. However, 16 ions are still produced by each particle, but they are now spread out over multiple measurement windows to provide roughly 5 ions per dwell time window, yielding an S/B ratio of 5.
From this example, the importance of shorter dwell times to detect smaller particles has been demonstrated. With this concept in mind, the analysis of smaller SiO2 particles was carried out at a shorter dwell time of 25 µs. The particle size distributions of SiO2 particles of 100 and 140 nm are shown in Figures 4 and 5, respectively. Table 3 shows the measured sizes and comparison against the certificate values, demonstrating the ability of SP-ICP-MS operating in standard mode to perform accurate characterization of SiO2 particles down to 100 nm.
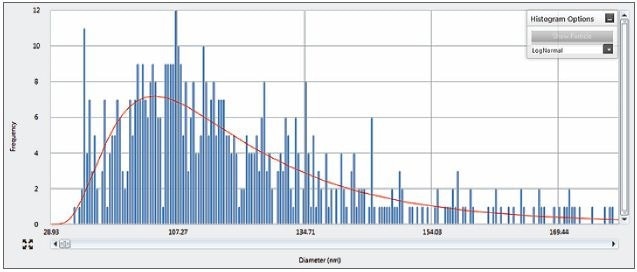
Figure 4. Particle size distribution for 100nm SiO2 particles measured with a 25µs dwell time.
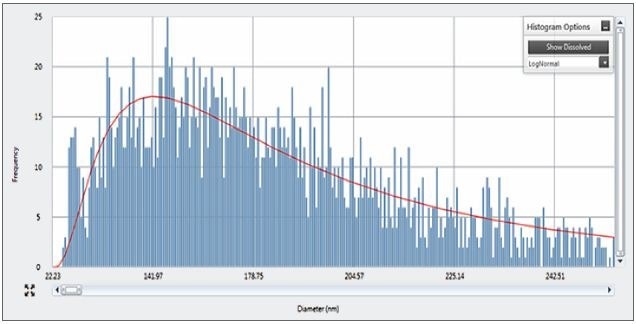
Figure 5. Particle size distribution for 140 nm SiO2 measured with a 25 µs dwell time.
Table 3. Size Measurements of 140 and 100 nm SiO2 Nanoparticles
| SiO2 Standards (nm) |
Most Frequent Size (nm) |
Mean Size |
Certificate* |
| 100 nm |
100 |
103 |
101.7 ± 4.5 |
| 140 nm |
143 |
143 |
142.4 ± 8.3 |
* as determined by transmission electron microscopy
Conclusion
This article has shown the capability of SP-ICP-MS operating in standard mode to perform SiO2 nanoparticle measurements. The analysis speed and the short dwell times are the key advantages of the NexION 350 ICP-MS single particle analyzer, enabling the measurement of 100 nm SiO2 particles in standard mode by reducing the background on Si. Going forward, characterization of smaller SiO2 particles in reaction mode will be the area of focus to reduce the background further. Although preliminary analysis has shown positive results, more extensive work is needed for comprehensive characterization of the analysis.

This information has been sourced, reviewed and adapted from materials provided by PerkinElmer Inc.
For more information on this source, please visit PerkinElmer Inc.