In recent years, the generation, measurement, and applied technologies of so-called nanobubbles or ultra-fine bubbles, with a diameter that ranges from tens to hundreds of nanometers, are evolving dramatically. Due to their unique properties, nanobubbles are used in several applications such as manufacturing of functional materials, decontamination, pharmaceutical delivery, and disinfecting food products.
The Fine Bubble Industries Association conducted a preliminary market research, which shows the size of the fine bubble business growing from USD 20 million in 2010 to USD 4.3 billion in 2020.
The Nanoparticle Tracking Analysis (NTA) technique is particularly adept at the detection and analysis (size, size distribution, number concentration) of these relatively low concentration structures of extremely small size (compared to ‘standard’ bubbles).
Due to the unique capability of the NTA technique, nanobubbles can be characterized by directly visualizing the nanoscale particles in suspension (40 nm to 1000 nm) with high-resolution, in real-time. Sample preparation is also minimal. This technique was pioneered by the NanoSight models from Malvern Panalytical, and these models continue to be the primary choice of the industry.
The presence of surface nanobubbles is becoming fairly well established after investigation from several groups. Following previous skepticism about their actual existence, more publications have been made recently on the confirmation of bulk nanobubbles in solution and their characterization.
Kaneo Chiba and Masayoshi Takahashi have demonstrated that with the correct physical stimulus and in the presence of electrolytes, stable nanobubbles can be developed from standard microbubbles [1]. The latter is likely to coalesce to large buoyant bubbles, which either collapse or float away under intense surface tension-derived pressure to the point that they vanish, as predicted by theory.
However, the addition of salt (electrolytes) is thought to cause the formation of a counter-ion screen around the nanobubbles, which effectively blocks the ability of gases within them to diffuse out (Figure 1).
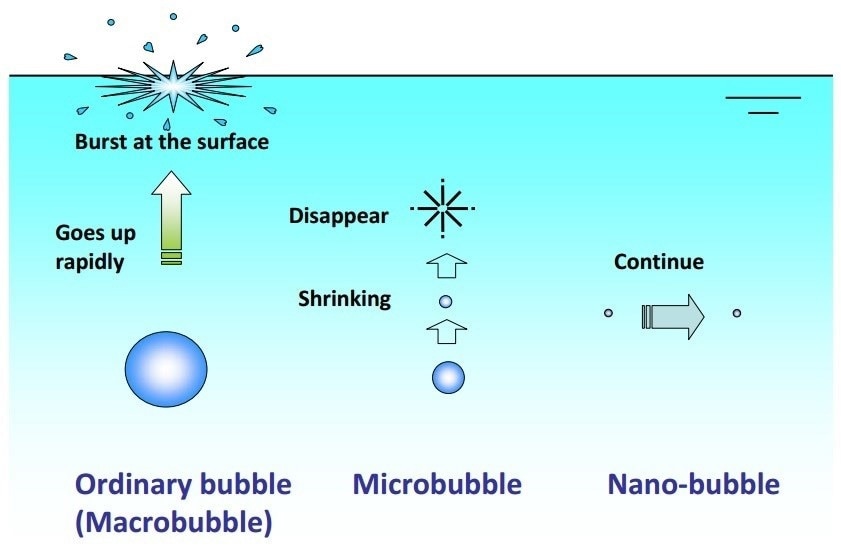
Figure 1. The formation of nanobubbles.
Characterizing Nanobubble Production
When measured without dilution, it is relatively common to observe nanobubble concentrations that are in the optimum concentration range for measurement with Malvern Panalytical's NanoSight NTA instruments. This relatively low concentration highlights that other conventional size analysis techniques like Dynamic Light Scattering (DLS) may lack adequate signal to make a reliable size measurement.
The following example illustrates a nanobubble sample after being recirculated through the generator for a specific time period. This was then compared to the starting ‘Production Water” and against normal tap water. While all samples showed some levels of particles present, the sample recirculated through the nanobubble generator displayed total particle concentrations approximately five times greater than either of the other samples tested.
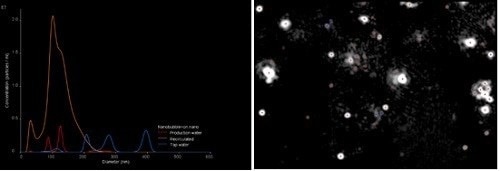
Figure 2. Comparison of NTA results for water recirculated through a nanobubble generator to tap water and production water and an image from the NTA analysis.
Nanobubble Formation by Electrolysis
The efficacy of aqueous solutions containing nanobubbles was investigated by Zhu et al [2] for the removal of model contaminants, Lyzosome and Bovine Serum Albumin, from surfaces and prevention of fouling by the same proteins. Before performing the cleaning experiments, the team used a NanoSight NS300 to validate the formation of nanobubbles by electrolysis in different solutions:
| Solution |
Description |
Concentration (x 106 particles/mL) |
| ec-H2O sub 450 nm |
Electrolyzed purified water with 2.1 mM NaCl, 450 nm filtered |
750 ± 50 |
| NaCl(aq) sub 450 nm |
Purified water with 2.1 mM NaCl, 450 nm filtered |
28 ± 2 |
| H2O sub 450 nm |
Purified water, 450 nm filtered |
3 ± 1 |
| ec-H2O sub 20 nm |
Electrolyzed purified water with 2.1 mM NaCl, 20 nm filtered |
3 ± 1 |
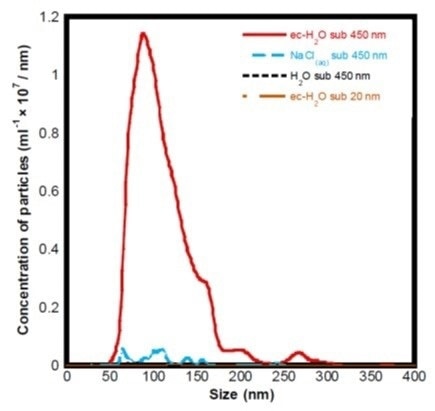
Figure 3. Histogram showing the particle size distributions and concentrations of different sample preparations obtained using the NanoSight NS300.
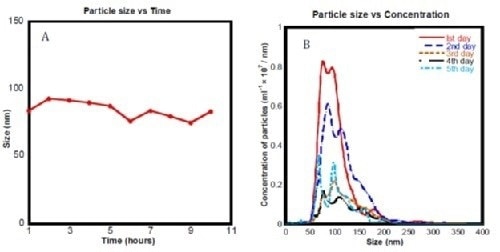
After coming to a conclusion that nanobubbles were best formed in electrolyzed water with 2.1 mM NaCl and passed through a 450 nm filter, they again used the NanoSight instrument to determine the stability of these particles over time:
 $
$
Figure 4. (a) Mean bubble size distribution for ec-H2O sub 450 nm measured using NTA over 10 hours. (b) Histogram showing particle concentration measured using the NanoSight samples of ‘ec-H2O sub 450 nm’ over 5 days.
Long-Term Stability of Hydrogen Nanobubblegasoline Blends
The long-term stability of hydrogen nanobubbles (HNB) in gasoline [3] was measured by Seung Hoon Oh et al. Currently, they are analyzing the introduction of hydrogen to enhance engine efficiency and emission performance. The HNB-gasoline blend was generated with a nanobubble generator through gas-liquid dispersion.
After the formation of nanobubbles, their stability was measured with NanoSight at a constant temperature of 25 °C for 121 days. After initial formation, the concentration and size were 11.3 ± 2.8 x10⁸ and 159 ± 32 nm particles/mL, respectively. Minor variability was observed without any major trends in concentrations and size after 121 days.
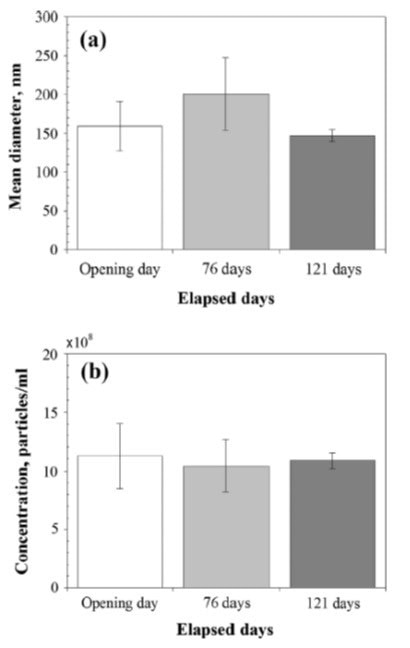
Figure 5. (a) Mean diameter and (b) concentration of hydrogen nanobubbles versus time.
References
[1] Takahashi, M., “Zeta Potential of Microbubbles in Aqueous Solutions: Electrical Properties of the Gas-Water Interface.” J. Phys. Chem. B 109 21858–64, (2005)
[2] Zhu, J., et al. "Cleaning with Bulk Nanobubbles." Langmuir: the ACS journal of surfaces and colloids (2016).
[3] Oh, Seung Hoon, Jung Guen Han, and Jong-Min Kim. "Long-term stability of hydrogen nanobubble fuel." Fuel 158 (2015): 399-404.a

This information has been sourced, reviewed and adapted from materials provided by Malvern Panalytical.
For more information please visit Malvern Panalytical.