Abstract
Wet bead milling is used to produce nanoparticle suspensions at industrial scales. Continuous monitoring of particle size during comminution would allow real-time end-point determination and critical quality attribute monitoring, reducing operational risk and increasing insight into particle breakage kinetics. Real-time monitoring would simultaneously increase manufacturing efficiency by eliminating the necessity for manual sampling. Here, a microextraction device coupled to a Spatially Resolved Dynamic Light Scattering (SR-DLS) instrument is presented. By continuously extracting 10-150 µL/min of process fluid and diluting before SR-DLS measurement in flow, nanoparticle size and size distributions (range: 10-2000 nm) can be monitored during milling of complex nanosuspensions with nanoparticle volume fractions up to at least 35%.
Introduction
Particle size reduction through wet bead milling (also known as nanomilling or stirred media milling) is widely-used for industrial scale production of nanoparticles for e.g. pharmaceuticals, pigmented inks, catalysts, and cosmetics1,2. In the pharmaceutical industry, milling of hydrophobic Active Pharmaceutical Ingredients (APIs) has great benefits, as reducing the average particle size of API crystals increases their surface area, which, in turn, increases their solubility and rate of solubilization in bodily fluids, allowing for higher bioavailability upon administration3,4. Alternatively, by tuning the API crystal particle size, tailorable sustained or burst drug release effects can be achieved, which is of value in the development of long acting injectable parenterals5.
Monitoring the progress in particle size reduction during milling of (nano)suspensions is done through particle size analysis. Depending on the expected final particle diameter, typically either laser diffraction (practical range ~0.5-500 µm) or Dynamic Light Scattering (DLS, practical range ~10-2000 nm) instrumentation is used6,7. For these methods, a sample is taken from the milling process, which has to be diluted, often sonicated and subsequently measured, usually in an analytical laboratory located away from the actual milling process. The off-line nature of these particle sizing methods often causes significant delays during batch production, and only offers limited options in evaluating milling kinetics. In milling suspensions, particle concentrations are typically ~10-40% by volume and contain complex excipients. Besides a high turbidity, such suspensions often also show non-Newtonian rheology, making direct inline measurement highly challenging. Although Process Analytical Technologies (PAT) that can measure particle size during milling in the micrometer range exist8,9, no PAT that can accurately and continuously measure in the nano-regime during milling is available.
Here, we showcase a newly developed commercially available PAT tool that can measure average nanoparticle size and particle size distributions of a nanosuspension in real-time during a milling process. Using this system, particle size and milling end-point determinations can be performed continuously, and highly detailed particle size characteristics are collected, which can be used for process optimization and dispersion development.
The benefits of integrating this system into a milling operation are significant (figure. 1). Specifically, integration of PAT reduces operating risk (e.g. avoiding unnecessary batch rejections caused by ending the milling too soon). Simultaneously, PAT integration into a milling setup increases manufacturing efficiency (by eliminating manual sampling and offline analysis) and process understanding (by extensively recording every milling operation performed). Finally, opportunities such as the option to more precisely manufacture, and integration of quality control during manufacturing or the option to utilize quality by design approaches also arise when integrating PAT into nanomilling.
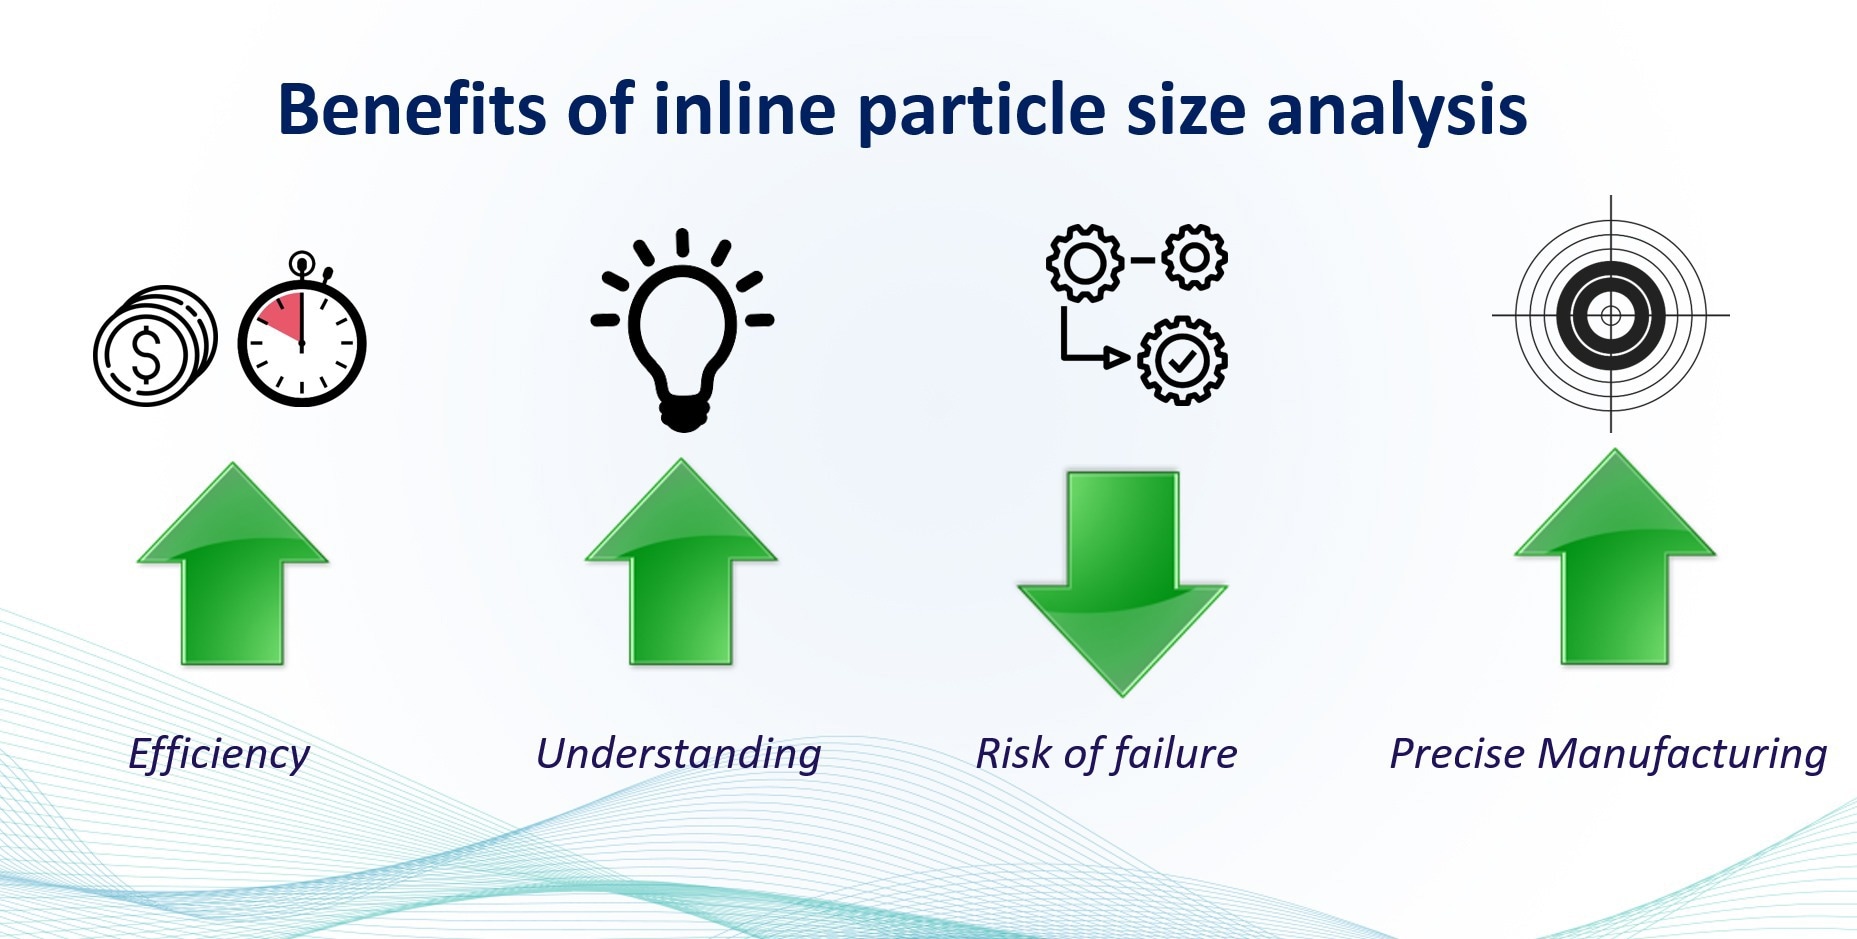
Figure 1. Some of the advantages of incorporating PAT into a nanomilling unit operation.
The NanoFlowSizer – OnlineMicroDilution (NFS-OMD) system:
The developed PAT system combines: (i) the NanoFlowSizer, a particle size analysis instrument using Spatially Resolved-Dynamic Light Scattering (SR-DLS)10. The NanoFlowSizer is capable of measuring particle size distributions in flowing highly turbid samples within 10 seconds. (ii) A microfluidic extraction and dilution device, capable of extracting and diluting minute amounts of process fluid from the milling process and providing this to the instrument for continuous online characterization. Both systems are explained below.
The Nanoflowsizer and SR-DLS
The NanoFlowSizer (shown in figure 2A.) is a new DLS-type instrument using low coherence interferometry to measure particle size in flowing, turbid nanosuspensions10. It employs SR-DLS technology (Figure 2B.) to resolve fluctuations and intensity auto-correlation functions (ACFs) of near infrared backscattered light over the depth of a sample. The fluctuations originate from both diffusion and flow of nanoparticles, both of which are analyzed from the spatially resolved ACFs (2C.). Information on particle diffusion coefficients is translated to particle size and size dispersity via the Stokes-Einstein equation11. The spatially resolved character of the measurement and related analysis methods yield accurate measurements of nanoparticle diffusion and hydrodynamic size, over suspension flow ranges ranging from a few ml/min to ~300L/hr, depending on the width of the flow cell used12.
Direct inline measurements of relatively low concentrated suspensions (< 5-10 volume %) are possible without any dilution. In milling suspensions, particle concentrations are typically ~10-40% by volume and contain complex excipients. Besides a high turbidity, such suspensions often also show non-Newtonian rheology, making direct inline measurement impossible due to aberrant particle diffusion behaviors as a result of shear thinning or thickening behaviors.
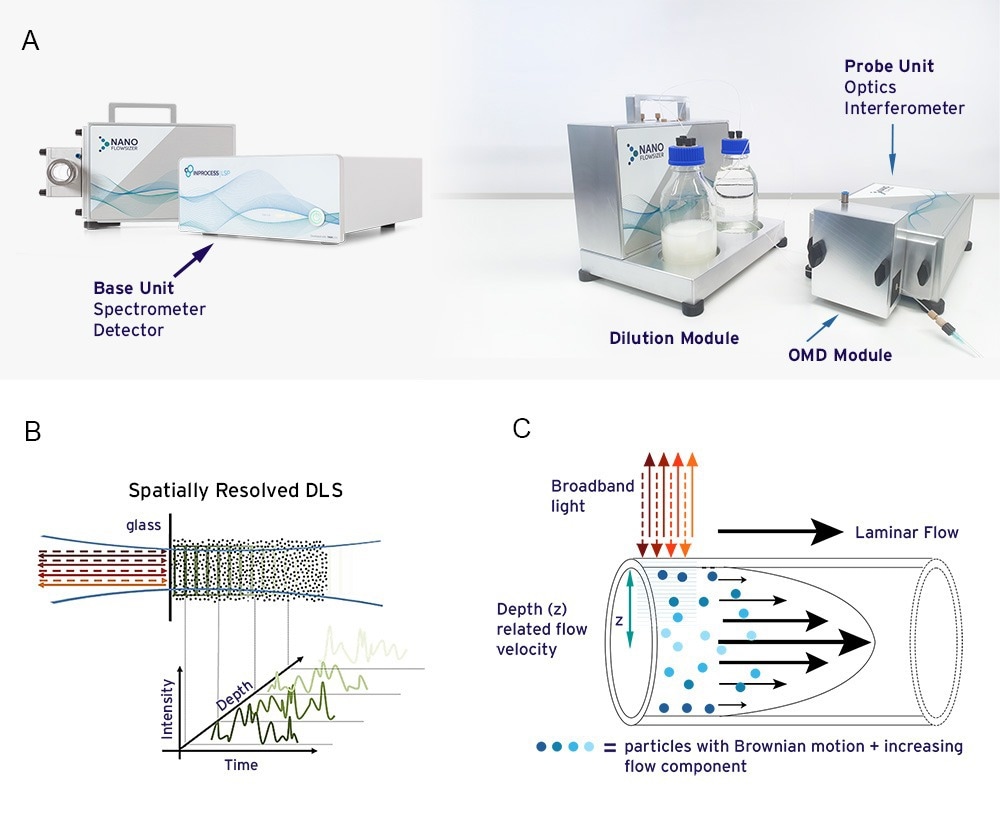
Figure 2A. The NanoFlowSizer instrument for measuring nanoparticle size characteristics of flowing suspensions up to high turbidity 2B. Spatially Resolved Dynamic Light Scattering (SR-DLS) as used in the NFS detects fluctuations of light scattered from nanoparticles as function of depth in the sample, with a few resolution, up to a few mm. 2C. SR-DLS allows nanoparticle size characterization in laminar flows by measuring fluctuations of light scattered perpendicular to the flow direction. This allows separate analysis of flow and diffusion from the scattered signals and flow compensation via dedicated algorithms.
The Online MicroDilution (OMD) module
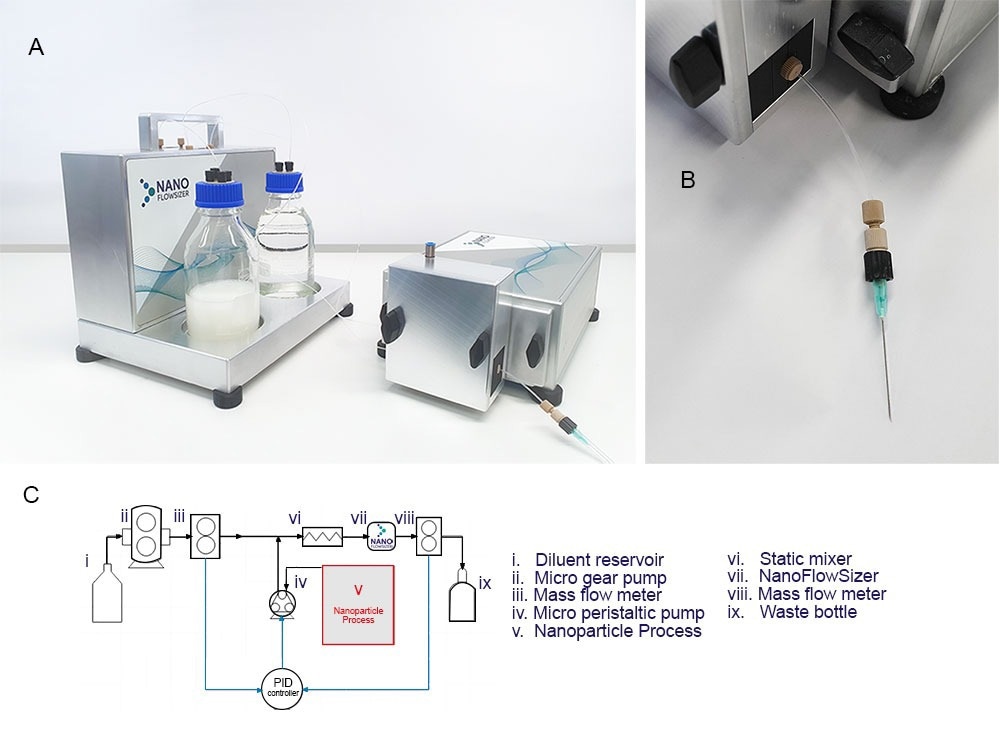
Figure 3A. Introducing the new Online MicroDilution (OMD) module for use with the Nanoflowsizer, pictured are: the diluent box (left, including massflow sensors, pumps, electronics for full control inside and diluent and waste bottles outside) and (right) the OMD module, which can be attached to the probe unit to interface the measurement system with wet bead milling processes through e.g. a sampling needle. 3B. A close up of the sampling needle attachment that can be used for sampling (note that other options are available upon request) 3C. Full control of the PAT tool and dilution module is possible using the purpose built Xspergo software. 3D. A Process flow diagram for the online microdilution add-on connected to the NanoFlowSizer, as operated when doing measurements during wet bead milling (full legend in main text), note that components i to iii and viii-xi are located in the diluent box and iv+vi-vii are incorporated in the probe unit.
To enable particle size monitoring of milled suspensions, the online microdilution device add-on has been developed for the Nanoflowsizer (figure. 3A). This microfluidic extraction unit (figure 3B) consists of a interface with the milling process (v., standard options are a sampling needle or Swagelok® port, see 3C) connected to a peristaltic extraction pump (iv.). This pump extracts ~10-150 µL/min of process fluid for dilution and analysis. Extracted material is combined with a suitable diluent (pumped from reservoir i. using gearpump ii) into a T-junction, after which mixing occurs in a micro-static mixer (vi.). after mixing, the dilute suspension is continuously measured in flow by the Nanoflowsizer (vii.), after which material is collected in a waste reservoir (ix.). To ensure a proper dilution ratio for analysis is used at all times, two mass flow sensors (ii and viii.) continuously check both solvent and total mixed suspension mass flow streams. These two sensors inform a PID system, which controls the peristaltic pump’s suspension extraction rate, allowing it to compensate for changes in the process that might affect the extraction rate such as drastic changes in suspension viscosity, or addition of new material. Control of the dilution system and the PAT instrument is possible using the dedicated software suite provided with the system (Xspergo 2, figure 3D).
Results and discussion
Operation and function of the OMD module
To set up functional and accurate particle size monitoring with the NanoFlowSizer and OMD module, both the dilution factor and process fluid extraction rate are important parameters to be established for routine operation.
Firstly, the dilution factor should be chosen appropriately for accurate particle size measurements. As mentioned, complex rheology of the undiluted suspension as a whole is the primary reason for dilution, but for dilution levels sufficient to yield Newtonian rheology, the diluted solvent may still exhibit a viscosity significantly larger than that of the diluent. In Fig. 4A, nanoparticle size measurements at various dilutions of a milled nanosuspension are shown. Indomethacin in water was used as a model API system for milling. Excipients such as anti-foaming agent (e.g. Sodium docusate), stabilizer (e.g. Polyvinylpyrrolidone), and surfactant (e.g. Tween 20, Poloxamer 338) were added to form stable nanosuspensions after milling. Such excipients increase the viscosity of the solvent in which the indomethacin NPs are suspended, reducing their diffusion rate. The effect of this is observed in the size data in figure 4A. for dilution factors <30×, which show an apparent increase in measured particle size (due to use of the pure diluent viscosity). Dilution factors >30× by volume were sufficient to remove any effect of residual excipient on the dilute suspension’s solvent viscosity, allowing for accurate particle size measurement in this range. Typically, dilution rates below 80× suffice to obtain a solvent viscosity within 1% of that of the diluent.
The second important parameter for OMD-NFS operation is the process fluid extraction rate, which can range from 1-180 µL/min. Using a low extraction rate (e.g. <25 µL/min) can cause unnecessary delay between sampling and actual measurement due to transport of process fluid through the extraction tubing, while a high rate (e.g. >150 µL/min) can cause excessive waste of (often valuable) process fluid during monitoring. figure 4B. shows the delay time between sample extraction and actual size measurement for the recommended range of extraction rates (50-150 µL/min, 3-9 ml per hour), as function of the tubing length. The delay times can be adapted but the range shown is typically well acceptable for e.g. process control, given the typical slow dynamics of the milling process. Depending on the specific process configuration, the process fluid extraction rate and dilution factor can be tuned to provide the optimum delay time.
The diluent flow rate is then set to obey the desired dilution factor. figure 4C. shows the diluent flow rate for several extraction rates as function of the dilution factors. For monitoring without significant delay, the optimal flow rates fall within the yellow area, indicating what can be expected for operation of the NFS-OMD device.
.
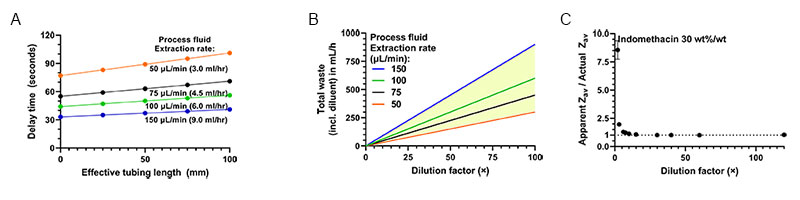
Figure 4A. Dilution series of a representative milled Indomethacin suspension (Zav size: 361 ±2 nm, PDI: 0.14, 30 wt%/wt% Indomethacin) showing the effect of dilution on solvent viscosity and associated accuracy of the particle size from SR-DLS. 4B The Online MicroDilution module introduces some delay between extraction and measurement, shown here as function of the tubing length (I.D. 0.5 mm) and for different extraction rates. Recommended extraction rates range from 50-150 µL/min, delays rates are calculated using a diluent flow rate of 2 mL/min 4C. Total waste per hour of online monitoring (based on the extraction rates in 4A) versus the dilution factor. For the recommended extraction rates, the yellow area shows the amount of waste.
Online nanoparticle size monitoring in wet bead milling setup operating in recirculation mode
API suspensions were milled and monitored to validate NFS-OMD for online monitoring of wet bead milling. All monitored milling runs were sampled from a recirculation tank (depicted in 5A.), using a 21G sampling needle attachment (0.8 mm O.D., steel bevelled tip, see 3B.).
An example of online monitoring results from a recirculation-based milling run (experimental setup depicted in 5A.) is shown in figure 5BCDEF. Specifically, a 10.0 wt%/wt Indomethacin in water, supplemented with 10.0 wt% Polyvinylpyrrolidone, 5.0 wt% Polaxamer 338, and 0.1 wt% Sodium Docusate was used. For validation purposes, samples were also manually taken and analyzed offline at the same dilution (30-50×) using the NFS with the vial module (static SR-DLS). Figure 5B. shows the reduction in particle size over time, which represents a typical trend for the grinding process during nano-milling. Note that the dashed line gives a y-axis cut-off particle size of 2 m, as typically DLS performs optimally below this size limit, with issues such as sedimentation and slow diffusion becoming an issue at larger particle sizes. Importantly, the offline validation results align with the online continuous monitoring results (figure 5BC.). This similarity shows that the online monitoring method is a valid way of monitoring particle size as a function of milling time. Looking more closely at the PDI results (5C.), one can appreciate that not only the average particle size is decreasing, but also the PDI is narrowing significantly over the course of the milling. A dip in the online PDI can be observed at early timepoints (before t=5 min, blue dots, 5C.) which is incongruent with the static PDI results for this timepoint (orange dots, 5C.). The measured PDIs are 0.72 ± 0.13 and 1.49 ± 0.21 for the online and offline determinations respectively. This deviation in the online determination of the PDI is due to the limitation of the in-flow measurement in measuring large particles. In practice, the use of SR-DLS in milling is focused towards the later stages of milling (particle size <2 µm), as such, this underappreciation is of little effect on the applicability of the method.
In figure 5D., several measured particle size distributions taken from the online monitoring are shown (generated every 10-20 seconds during monitoring). Interestingly, it can be observed that the particle size moves gradually over time from a high size monomodal (orange line, 5D.) to a lower size distribution with a fraction of large particles (green line, 5D.) to a more uniform monomodal distribution of small particles as the grinding limit for this system is approached (black line, 5D.), note that these results are perfectly in line with the observations from the particle size and PDI curves.
Besides the SR-DLS size characterization capabilities, the NanoFlowSizer system also offers cross-sectional imaging of suspensions during monitoring. This is achieved by lateral high-speed scanning of the measurement beam perpendicular to the flow direction (i.e. in the plane shown in the sketch in 2C), generating images of the suspension in flow as shown in 5E-F. These images provide highly useful additional information on the state of the sampled suspension: the bright features observed in 5E. (at the early stage of milling) represent strong backscattering from particles typically ≥ 1 µm and can be analyzed to provide additional sensitive information on tails of the PSD. This also helps as quick troubleshooting tool to determine root causes for potential deviations during milling or to check for the presence of large contaminants in milled product. The images cover up to ~5 mm width and 2.5mm depth in the suspension, with a resolution ~20 µm laterally and a few micron in depth.
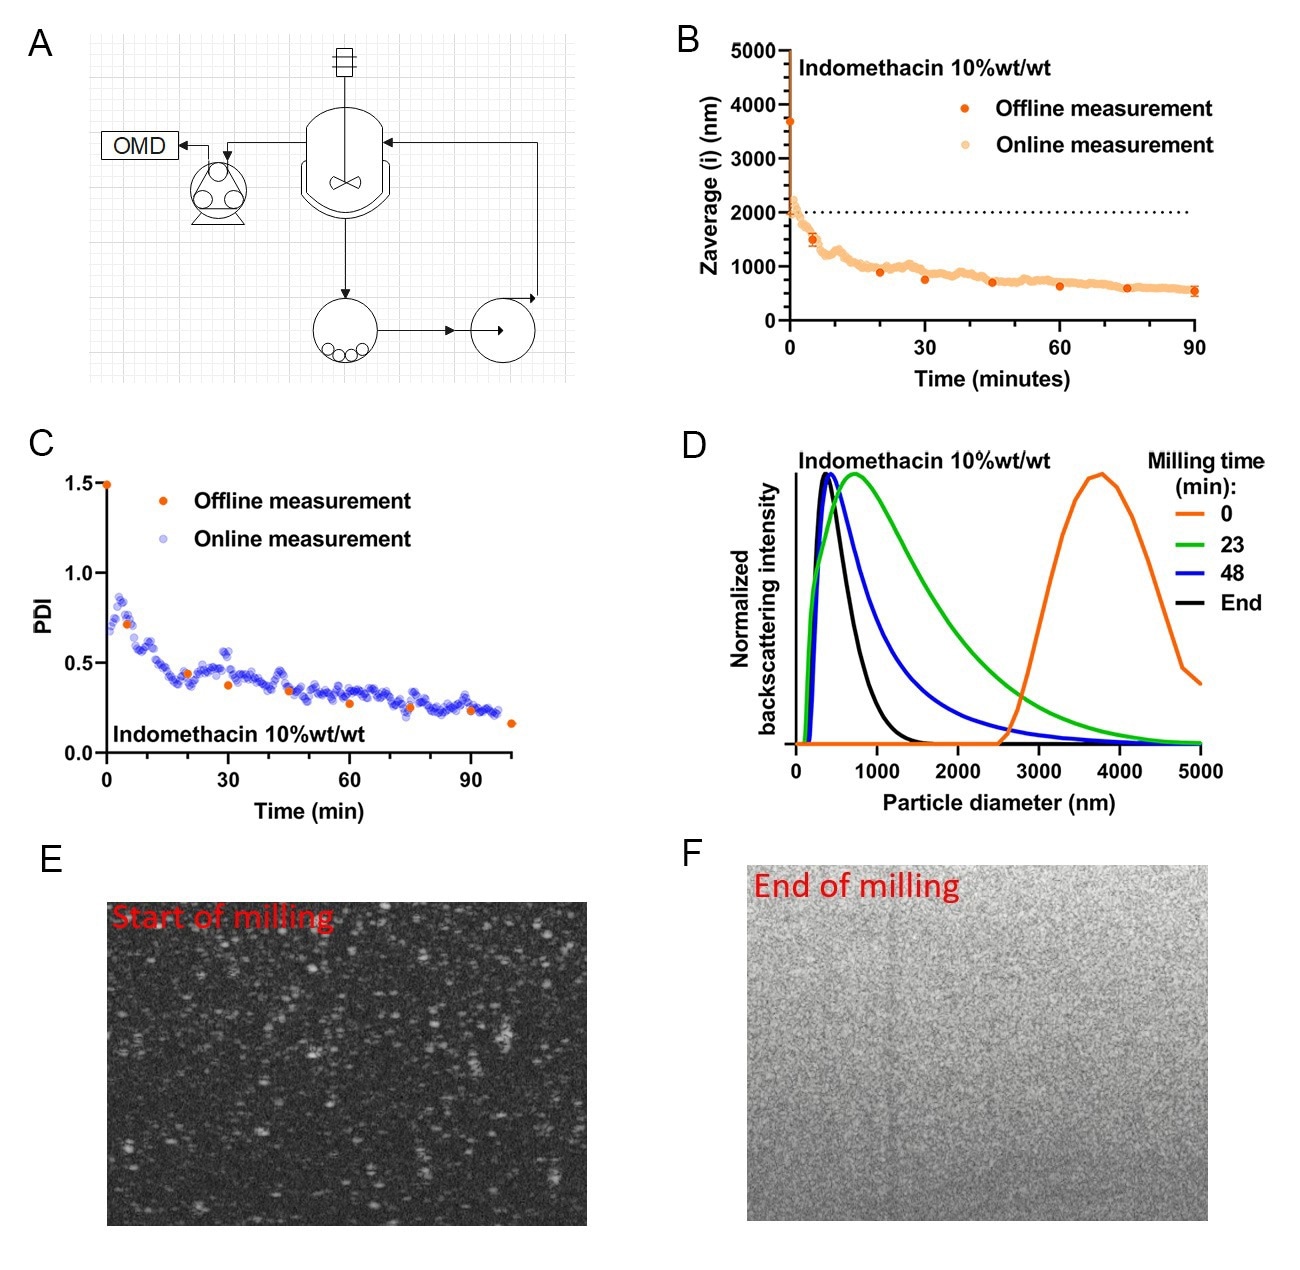
Figure 5A. Process flow diagram for the online microdilution device add-on as it is integrated into a recirculation mode milling experiment. 5B.Online versus Offline Zaverage Particle size over time for milling a 10 wt%/wt% indomethacin suspension. 5C. PolyDispersity Index (PDI) measurement, done in parallel to particle size, for the same 10 wt%/wt% indomethacin milling experiment. 5D. Particle Size Distributions of several online measured timepoints ranging from timepoint 0 to the last sample measured. 5EF. A tomographic B-scan image taken at the start and the end of the milling run (pictures are representative of the PSD shown as the orange and black trace in 5D.) these types of images can be taken in tandem with PSD monitoring using the same hardware/software combination present in the PAT system.
Extraction and size monitoring of high particle concentration suspensions during milling
Often, particle concentrations in wet bead milling are high (>>10 wt%/wt) due to more favorable milling kinetics and cost/product optimization. To model such conditions, a 30 wt%/wt Indomethacin suspension, with the same excipient mix as detailed previously was prepared for use in wet bead milling. As the particulate concentration in this type of sample is significantly higher, we first established at which point the radial micro-peristaltic pump present in the OMD module is capable of pumping this suspension. Typically, the radial design of peristaltic pump is excellently suited for pumping shear-thinning fluids such as particulate suspensions due to the high shear rates generated during the peristalsis in these pumps significantly reducing the relevant suspension viscosity13.
Practically, for high concentration (>10 v%) suspensions with an average particle size >5 µm, we would advise to only start monitoring the milling run with the OMD module when an average particle size that is in the accurate range (ie. <2 µm) of the SR-DLS method is expected. Note that most APIs are micronized prior to wet bead milling (i.e. dry milled to yield only micron sized particles, typically measured by laser diffraction), as a result, suspensions based on micronized API can be sampled right from the start of the milling run, even at high particle concentrations. As a rule of thumb, waiting for 20% of the total expected milling time to start online monitoring is sufficient to allow for process fluid extraction whilst still monitoring the milling operation for the end-point of milling, potential overmilling and general milling kinetics into the nano-regime.
A non-micronized 30 wt%/wt Indomethacin suspension was milled in a recirculation loop (as depicted in figure 5A.). Monitoring of this milling run started 9 minutes after the start of milling to ensure proper extraction of the process fluid. Comparing the evolution of the online particle size monitoring data with the offline data again yields a close correspondence, indicating no significant difference between the online and offline methods exists (figure 6AB.). Next to the possibility to determine average particle size, PDI, PSDs and scanned images of the milled product at any time during milling, PSD characteristics such as intensity or volume weighted D10,50, and 90 data can also be collected in real time during milling. The results in 6C. show that these characteristics gathered from the online measurement also match closely with the corresponding offline data collected by sampling and subsequent manual dilution and static measurement. The ability to measure D90 particle size data is especially crucial in quality control of pharmaceutical nanocrystal milling, as it is often a critical quality attribute.
In other experiments (not shown), several proprietary suspensions with an API crystal concentration of up to 50% by weight (~35% by volume) were also successfully measured using the NFS-OMD system. The results presented here taken together show the excellent performance of the developed PAT system to monitor nanoparticle size in real time for a range of concentrations and formulations during milling
.
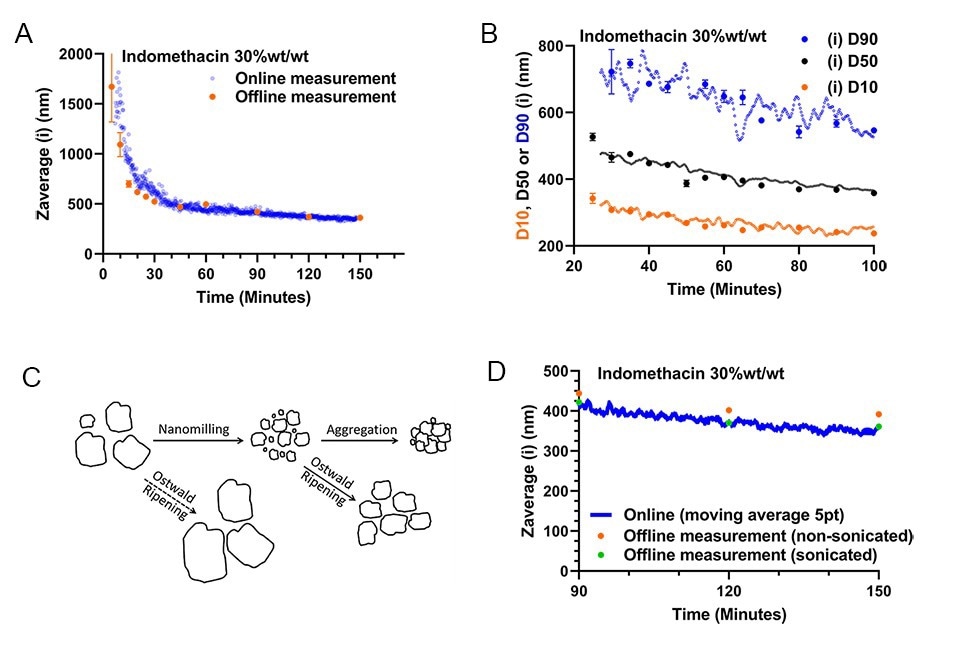
Figure 6A. Online versus Offline Zav size versus process time for recirculated milling of a 30 wt%/wt% indomethacin suspension. 6B. Corresponding Intensity-weighted D10,50, and 90 from the simultaneously measured PSDs 6C. Possible grinding and particle growth/aggregation mechanisms that can occur for API nanocrystal suspensions (adapted with permission4). 6D. Comparison of the last online datapoints in 6A to sample aliquots analysed 14 days after milling, with and without sonication step prior to measurement.
As a final note, manually collected nanosuspension samples taken from API wet bead milling that are to be analyzed off-line at a later point, have to be sonicated before measurement. This sonication step serves to de-aggregate the milled primary particles, for more accurate sizing of the primary particles (see 6C.). An experimental validation of this (de-)aggregation effect can be seen in detail for the last hour of monitoring (figure 6D.). Specifically, samples (t=90, 120 and 150 min.) that were stored for 14 days after milling, were measured with and without sonication, and compared to the online monitoring data. Notably, the non-sonicated and sonicated samples differ in particle size 5.5 to 8.6%, whilst the particle size data collected online and offline after sonication differ less than 1.7%. Importantly, by utilizing online monitoring, no sonication of the sample is required, as the nanosuspension analyzed is extracted, diluted and measured within ~30-90 seconds after leaving the milling circuit, not allowing for any aggregation of primary particles to occur. It is thus possible to measure the primary particle size of the milled product in real-time without sonication.
Conclusion
Using an online microfluidic extraction and dilution system with the Nanoflowsizer, it is possible to measure the particle size of highly concentrated nanosuspensions online in real-time during milling with minimal waste and delay. Practically, milled API suspensions were found monitorable up to at least 40 wt% particle content (~35% by particle volume fraction). This online monitoring, performed continuously, can determine milling progress and help inform decisions about the stopping the mill whilst giving detailed real-time insight into milling kinetics and product size characteristics. Importantly, integrating the presented PAT system into a milling unit operation would increase process insights and eliminate the necessity for manual sampling, leading to reduced operating risk, higher manufacturing efficiency and new opportunities in process design and quality control.
References
(1) He, M.; Wang, Y.; Forssberg, E. Slurry Rheology in Wet Ultrafine Grinding of Industrial Minerals: A Review. Powder Technol. 2004, 147 (1), 94–112. https://doi.org/10.1016/j.powtec.2004.09.032.
(2) Kwade, A. Wet Comminution in Stirred Media Mills — Research and Its Practical Application. Powder Technol. 1999, 105 (1), 14–20. https://doi.org/10.1016/S0032-5910(99)00113-8.
(3) Kesisoglou, F.; Panmai, S.; Wu, Y. Nanosizing—Oral Formulation Development and Biopharmaceutical Evaluation. Adv. Drug Deliv. Rev. 2007, 59 (7), 631–644.
(4) Shi, Y.; Lu, A.; Wang, X.; Belhadj, Z.; Wang, J.; Zhang, Q. A Review of Existing Strategies for Designing Long-Acting Parenteral Formulations: Focus on Underlying Mechanisms, and Future Perspectives. Acta Pharm. Sin. B 2021, 11 (8), 2396–2415. https://doi.org/10.1016/j.apsb.2021.05.002.
(5) Keck, C. M.; Müller, R. H. Size Analysis of Submicron Particles by Laser Diffractometry—90% of the Published Measurements Are False. Int. J. Pharm. 2008, 355 (1), 150–163. https://doi.org/10.1016/j.ijpharm.2007.12.004.
(6) Stenger, F.; Mende, S.; Schwedes, J.; Peukert, W. The Influence of Suspension Properties on the Grinding Behavior of Alumina Particles in the Submicron Size Range in Stirred Media Mills. Powder Technol. 2005, 156 (2), 103–110. https://doi.org/10.1016/j.powtec.2005.04.005.
(7) Emmerich, J.; Tang, Q.; Wang, Y.; Neubauer, P.; Junne, S.; Maaß, S. Optical Inline Analysis and Monitoring of Particle Size and Shape Distributions for Multiple Applications: Scientific and Industrial Relevance. Chinese J. Chem. Eng. 2019, 27 (2), 257–277. https://doi.org/10.1016/j.cjche.2018.11.011.
(8) Meng, W.; Sirota, E.; Feng, H.; McMullen, J. P.; Codan, L.; Cote, A. S. Effective Control of Crystal Size via an Integrated Crystallization, Wet Milling, and Annealing Recirculation System. Org. Process Res. Dev. 2020, 24 (11), 2639–2650. https://doi.org/10.1021/acs.oprd.0c00307.
(9) Besseling, R.; Damen, M.; Wijgergangs, J.; Hermes, M.; Wynia, G.; Gerich, A. New Unique PAT Method and Instrument for Real-Time Inline Size Characterization of Concentrated, Flowing Nanosuspensions. Eur. J. Pharm. Sci. 2019, 133, 205–213. https://doi.org/10.1016/j.ejps.2019.03.024.
(10) Einstein, A. On the Motion of Small Particles Suspended in Liquids at Rest Required by the Molecular-Kinetic Theory of Heat. Ann. Phys. 1905, 17 (549–560), 208.
(11) Dreckmann, T.; Boeuf, J.; Ludwig, I.-S.; Lümkemann, J.; Huwyler, J. Low Volume Aseptic Filling: Impact of Pump Systems on Shear Stress. Eur. J. Pharm. Biopharm. 2020, 147, 10–18.
(12) Schuurmans, C., et al. "Inline particle sizing in flow for demanding nanosuspension processes. Published online 2022, freely available at: https://www.inprocess-lsp.com/downloads-free/ DOI: 10.13140/RG.2.2.18231.80805
Acknowledgments
This project is funded via the Horizon 2020 consortium ‘PAT4NANO’ (grant nr. 862413).
Materials and Methods
Materials and milling suspension preparation
Indomethacin was sourced from TCI (TCI Europe N.V., Belgium) and had a reported purity of >98%. The Indomethacin was used as received, and did not have any particle size grade or specification (i.e. no micronization prior to milling was performed). Polaxamer (P338, Kolliphor P338) and Polyvinylpyrrolidone (PVP, Kollidon 30) were purchased from BASF Pharma, Germany. Finally, pharmaceutical grade Sodium Docusate was obtained from Sigma-Aldrich, The Netherlands.
To prepare a milling suspension, first the P338 was dissolved in cold tapwater under magnetic stirring. Upon visible dissolution of the P338, the sodium docusate and PVP were added, and dissolution continued overnight under magnetic stirring at room temperature. Prior to milling, the indomethacin (10.0 or 30.0 wt%/wt%) was added to the excipient solution (end concentration: 10.0, 5.0 and 0.1 wt%/wt% P338, PVP, and Sodium Docusate respectively) and homogenized under low shear via vigorous shaking and, if not used for milling directly, placed on a rollerbench. Suspensions were not high shear homogenized or dispersed further prior to the milling operation.
Milling in Recirculation mode
For the wet bead milling experiments, an horizontal agitator type bead mill was used (Dyno®-Mill RL, Willy A. Bachofen AG, Switzerland) with a 250 mL funnel and 80 mL grinding chamber. Zirconium oxide Agitator discs of the Dyno® agitator disc design were used. The Silicon carbide grinding chamber was filled 60% (by volume) with microbeads based on polystyrene crosslinked with divinylbenzene (PuroMill™ PM5000) with an average diameter of 550 µm. For a typical experiment, 250 mL of suspension was milled, with the mill itself acting as recirculation pump and the funnel acting as recirculation vessel (also see Figure 4A.). For all recirculation experiments a tip speed of 15.7 m/s was utilized. At fixed timepoints, 2 mL aliquots were collected for later off-line dilution (30-50× by volume) and analysis using the NFS with the vial module attachment after bath sonication for 2 minutes.
Milling monitoring in Recirculation mode
The OMD extraction device was placed next to the mill, and the sample extraction needle was submerged into the recirculation reservoir and extraction either started immediately upon start of milling (Indomethacin 10 wt%/wt%) or after 5-10 minutes of milling (Indomethacin 30 wt%/wt%). All extracted suspensions were diluted 30-50× by volume prior to measurement in flow, in accordance with the observations in figure 3CD.
The NFS was used to analyze (intensity weighted) Zav, and PDI using cumulant analysis, and D10,50,90 of the intensity weighted size distribution obtained via Laplace inversion of the SR-DLS correlation function, with a smoothing factor of 0.3, minimum and maximum particle size of 5 and 5000 nm, respectively and 150 size bins. Furthermore, B-scan imaging in flow for the end product of the (online diluted) 10 wt% indomethacin milling experiment was done using the NFS scanning function. For more information on SR-DLS measurements in flow, see reference 12.

This information has been sourced, reviewed and adapted from materials provided by InProcess-LSP.
For more information on this source, please visit InProcess-LSP.