Polymers are used in many industries, including food packaging, tire manufacturing, adhesives, and medical-grade plastics.
Photothermal atomic force microscope-based infrared spectroscopy (AFM-IR) provides nanoscale chemical characterization and is especially useful for studying polymers due to their high thermal expansion coefficients.
This article looks at the various applications of AFM-IR in polymer research, such as identifying polymer species, quantifying polymer components, and characterizing functional polymeric materials.
The findings of AFM-IR research provide valuable insights into the chemical compositions, distributions, and behaviors of polymers, which drive the creation of improved polymer formulations and structures with micro- and nanoscale features.
Photothermal AFM-IR Technology
The invention of photothermal AFM-IR has changed polymer research by combining the excellent spatial resolution of AFM with the chemical identification capabilities of IR spectroscopy to allow for nanoscale chemical characterization.1
AFM-IR works by mechanically detecting the excitation of an AFM probe generated by a sample's thermal expansion during IR absorption. Polymers' relatively high thermal expansion coefficients produce significant AFM-IR signals, making them ideal candidates for this method.
AFM-IR has been used to study a diverse spectrum of polymeric materials, including multilayer films, polymer blends and composites, thin films and coatings, polymer fibers, polymer nanostructures, and biodegradable polymers. The need for improved polymer performance in these areas has prompted the creation of polymeric formulations and structures with micro- and nanoscale characteristics.
Bruker's photothermal AFM-IR technology, with high detection sensitivity (<1 nm thickness on non-metal substrates)2 and sub-5 nm lateral resolution, is highly effective in identifying and mapping chemical compositions in polymer blends, revealing local variations in crystallinity and their effects on macroproperties, distinguishing surface and bulk behaviors of advanced polymers, understanding nanoscale bonding mechanisms in polymer metal complexes, and more.
Identification of Polymer Species on the Nanoscale
Each polymer has distinct absorption bands in the IR fingerprint region that can be used to identify polymer species.
Photothermal AFM-IR spectroscopy correlates well with conventional Fourier transform infrared spectroscopy (FTIR), and the AFM-IR spectra generated on Bruker's nanoIR and Dimension IconIR® systems can be imported into FTIR libraries for digital searches, allowing for nanoscale chemical identification.
The AFM-IR technique has been used to identify polymers and their distributions in a variety of samples, including polymer blends, polymer components in hybrid materials, such as printing ink and automobile tires, polymer contaminants on semiconductor wafers, polymers in asteroids, meteorites, shale rocks, bitumen, and drinking water.3,4
The results of AFM-IR measurements provide essential information for the discovery of polymeric species and for improving polymeric product production and engineering processes.
Figure 1 depicts the AFM-IR results for a polymer mix of three components: polystyrene (PS), polymethyl methacrylate (PMMA), and polyvinylpyrrolidone.
Figure 1a's topography image shows various phases, including bright circular domains around 1 µm in diameter and 500 nm in height and smaller domains up to 20 nm in diameter and 5 nm in height.
Circular shallow holes with depths of only a few nanometers and sizes ranging from 300 nm to 1.4 µm are less noticeable. The final phase is a flat, continuous matrix.
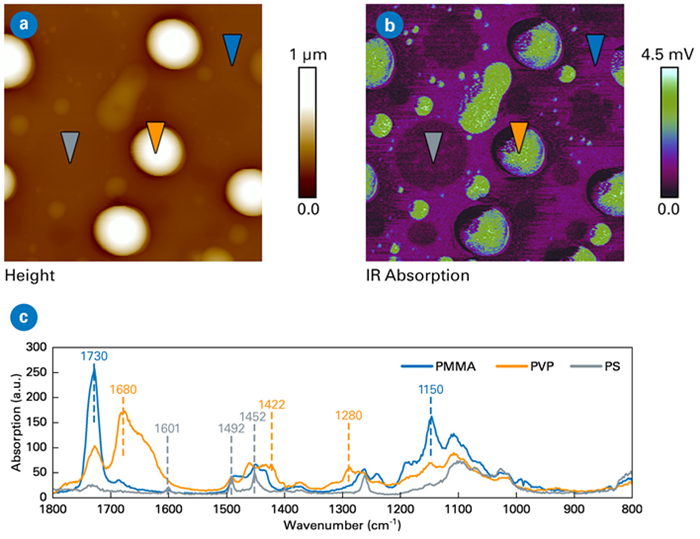
Figure 1. AFM-IR data from a PS-PMMA-PVP blend. Scan sizes 5x5 μm. a) Topography image, b) IR absorption image at 1422 cm-1, c) AFM-IR spectra. Sample courtesy of Philippe LeClere, University of Mons, Belgium. Image Credit: Bruker Nano Surfaces and Metrology
Figure 1c shows the AFM-IR spectra taken from three different sites. The topography image identifies these sites by colored markers that correspond to the spectra of the same color.
The domains, holes, and matrix are classified as PVP-, PS-, and PMMA-dominant regions, respectively, based on their characteristic IR absorption bands: PS (1452, 1492, and 1601 cm-1), PMMA (1150 and 1730 cm-1), and PVP (1280, 1422, and 1680 cm-1).
IR absorption images were taken at various wavenumbers, with the image at 1422 cm-1 displayed as an example in Figure 1b, clearly showing both large and small PVP domains.
Quantification of Polymer Composites
The amount of each component in different domains is an important part of polymer blends, as the chemical composition substantially impacts the blend's overall performance.
AFM-IR allows researchers to calibrate their data and obtain quantitative information on mass mixes using bulk FTIR.
Su and colleagues pioneered using AFM-IR spectroscopy to quantify the concentrations of polyethylene (PE) and polypropylene (PP) components in high-impact polypropylene's three nanoscale domains - matrix, intermediate layer, and core.5
In another study, AFM-IR spectroscopy was used to measure interface thickness and diffusion gradient across a polyamide/polypropylene (PA/PP) laminate.6
A more recent work used AFM-IR to determine drug loading in polymeric nanoparticles.7 Seven poly(lactic acid) (PLA) nanoparticles were employed as nanocarriers for Re(I) tricarbonyl diselenium, an anticancer medication.
Figure 2a shows the topographical image, which displays PLA nanoparticles ranging in size from tens to several hundred nanometers. Drug loading and dispersion inside individual nanoparticles were studied.
First, a calibration curve was created using conventional IR microspectroscopy on PLA/drug homogenous films with specified compositions. Individual nanoparticles were then analyzed using local AFM-IR spectra and IR mappings of PLA and drug.
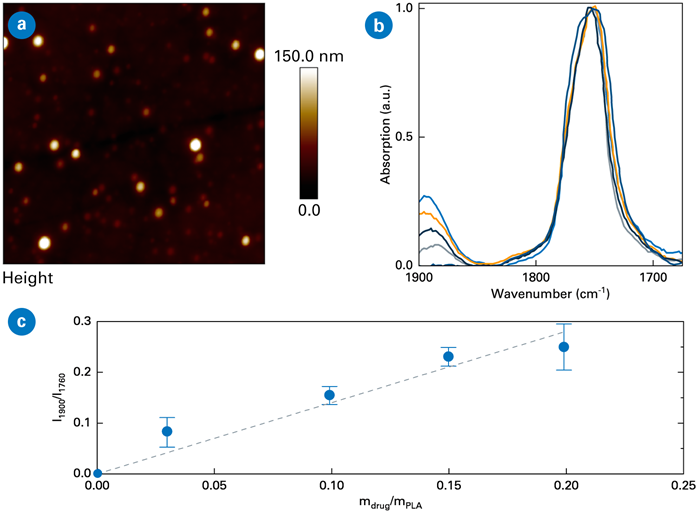
Figure 2. AFM-IR quantification of drug loading in PLA nanoparticles. a) Topography (scan size 7x7 μm), b) AFM-IR spectra showing characteristic IR peaks, c) intensity ratio of IR bands at 1900 and 1760 cm-1 as a function of the drug-to-PLA weight ratio. Image Credit: Bruker Nano Surfaces and Metrology
Figure 2b shows AFM-IR spectra from several nanoparticles, showing characteristic absorption bands at 1760 cm-1 for PLA and 1900 cm-1 for the drug.
The intensity ratio of these bands correlated with the drug-to-PLA weight ratio (Figure 2c), with drug loadings ranging from 0 to 21 wt% among the nanoparticles. IR mapping also revealed drug distribution within individual nanoparticles. This work shows how AFM-IR can be used for reliable quantification in the quality control of nanomedicines.
Characterization of Functional Polymeric Materials
AFM-IR has been used to characterize many functional polymers, providing information about their nanoscale chemistry, structure, and property relationships.
This knowledge is essential for upgrading existing polymer manufacturing techniques to improve performance and generating novel polymers with desired properties. The three examples below are just a small sample of what has become a widespread use for AFM-IR.
Biodegradable Polymers
Biodegradable polymers, such as polylactic acid (PLA), have the potential to become sustainable alternatives to typical fossil-based polymers. Pure PLA has a high crystallinity, which makes it challenging to foam.
Blending PLA with other polymers, such as biodegradable poly(3 hydroxybutyrate co-3 hydroxyvalerate) (PHBV), is a promising way to increase its foaming behavior, which is critical for insulation and cushioning.
AFM-IR was used to investigate the morphology, inhomogeneous distribution, foaming, and crystallization behavior of this biodegradable polymer blend, with PHBV concentration ranging from 0 to 40%.8
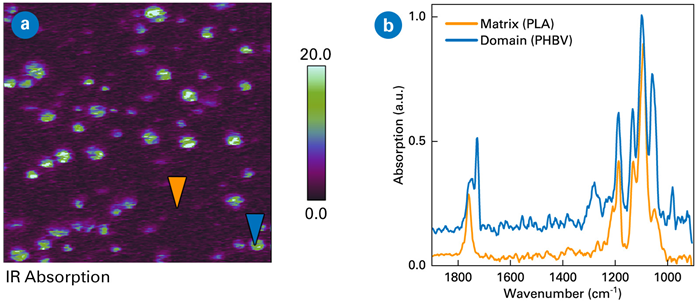
Figure 3. AFM-IR characterization of PLA/PHBV blend with 10% PHBV. Scan sizes 5x5 μm. a) IR ratio image of 1750 and 1760 cm-1, b) AFM-IR spectra measured at positions indicated in the phase image. Image Credit: Bruker Nano Surfaces and Metrology
Figure 3 shows the results of a 10% PHBV blend. IR absorption images at 1750 cm-1 (PHBV) and 1760 cm-1 (PLA) were recorded. The ratio image (1750/1760) in Figure 3a shows an inhomogeneous distribution of PHBV domains in the PLA matrix, with the size and shape of the domains varying with PHBV content. The AFM-IR spectra in Figure 3b confirm PLA as the matrix and PHBV as the domains.
These findings have important consequences for the characteristics of PLA/PHBV blends, specifically their crystallization and foaming behavior. At low PHBV content, the PLA matrix prevents tiny PHBV domains from crystallizing. This impediment reduces when PHBV content increases.
Higher PHBV content causes an increase in complex modulus, which negatively affects foaming. As a result, foam morphology with higher PHBV concentration showed larger density, higher cell and nucleation densities, and smaller cell diameters.
Ferroelectric Polymers
Ferroelectric polymers play essential roles in reconfigurable electronic devices, including poly(vinylidene fluoride) (PVDF) and its binary and ternary copolymers.
The AFM-IR technique was utilized to analyze P(VDF-TrFE), which features a dominating crystalline β phase with an all-trans structure.9 This study, reported in Science, demonstrated that the P(VDF-TrFE) polymer has a concentric toroidal polar structure for the first time.
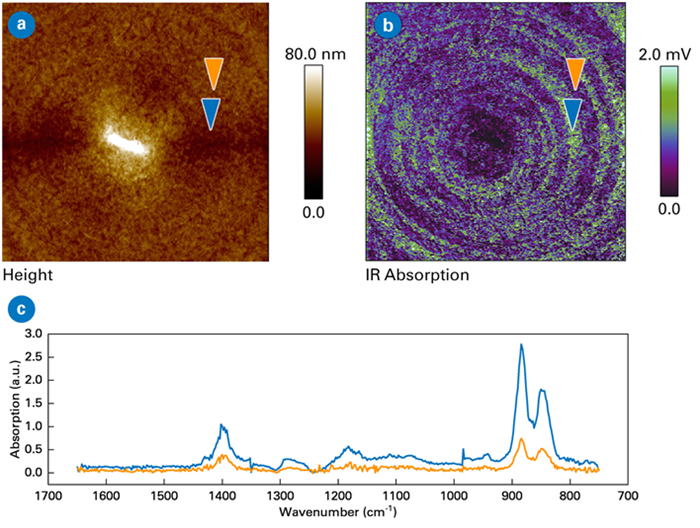
Figure 4. AFM-IR measurements of P(VDF-TrFE). Scan sizes 10x10 μm. a) Topography image b) AFM-IR absorption image at 880 cm-1 exhibiting toroidal polar topology for the lamellae c) AFM-IR spectra measured at neighboring bands marked by arrows in the absorption image. Image Credit: Bruker Nano Surfaces and Metrology
The AFM-IR spectra acquired from the P(VDF-TrFE) lamellae revealed distinctive IR absorption bands, including one at 880 cm-1 corresponding to the symmetric stretching of the CF2 group. The IR absorption image at this wavenumber showed a spatially alternating pattern compatible with the toroidal structure, as seen in Figure 4.
The effective alignment of the P(VDF-TrFE) lamellar crystals, which had interchain dipoles directed perpendicular to the polymer chains, facilitated the creation of this topology.
When the IR polarization was parallel to the film plane, a spatially periodic absorption pattern appeared due to the constant fluctuation in local absorptions of face-on lamellae caused by alternating toroidal ferroelectric polarizations.
Bonding Mechanism in Metal-Plastic Composites
Metal-plastic hybrids have sparked substantial attention in engineering sectors due to the increased desire for weight reduction. Achieving direct bonding between metal and plastic is especially desired in such hybrids.
One recent study used the AFM-IR approach to investigate the aluminum/polyamide 6 (PA6) hybrid, revealing direct evidence of strong hydrogen bonding at the interface.10
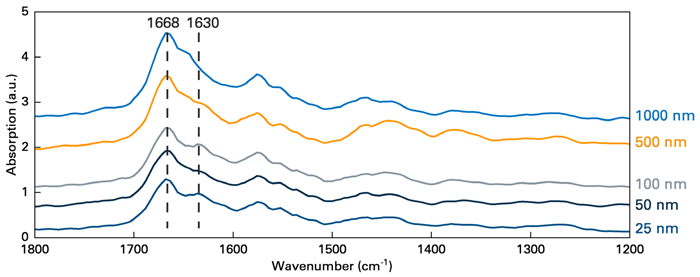
Figure 5. AFM-IR spectra collected from the Al/PA6 interface, which showed an additional peak at 1630 cm-1 due to hydrogen bonding formation. Image Credit: Bruker Nano Surfaces and Metrology
In this study, the aluminum plate was hydroxylated to form an amorphous AlOOH structure on its surface before being connected with PA6 by injection insert molding.
AFM-IR spectra were acquired from five places (Figure 5): three in the bonding zone, which is around 100 nm in size, and two in the PA6 bulk. While all spectra showed the free C=O stretching band of PA6 at 1668 cm-1, those from the bonding region had an extra peak at 1630 cm-1.
This new peak was attributed to the hydrogen-bonded C=O stretching of PA6, demonstrating hydrogen bonding between amorphous AlOOH and PA6. These hydrogen bonds add to the bonding strength between the aluminum plate and the PA6 polymer.
Correlative Study of Polymer Blends
When paired with other AFM modes, AFM-IR's chemical identification capacity can be linked to topographical, mechanical, and electrical data, allowing for a more complete evaluation of polymeric samples.
Bruker's AFM-IR platforms provide AFM modes like PeakForce Tapping®, which allow for correlative measurements to be taken concurrently or sequentially at the same sample area.
This powerful correlative technique delivers previously unseen insights about sample attributes. Various polymeric samples were examined using correlative AFM and AFM-IR modes. Figure 6 shows the chemical, mechanical, and electrical images of a PS/PE polymer blend.
The circular domain is identified as PE by IR mapping at 1464 cm-1, which corresponds to the CH2 bending mode. The PS matrix has greater absorption at 1492 cm-1 due to its aromatic ring stretch. Mechanical mapping reveals that the PE domains have stronger adhesion to some fine features and lower modulus.
Kelvin probe force microscopy (KPFM) electrical mapping reveals that PE has a higher potential and lower dielectric. These approaches complement one another, giving a comprehensive perspective of the sample.
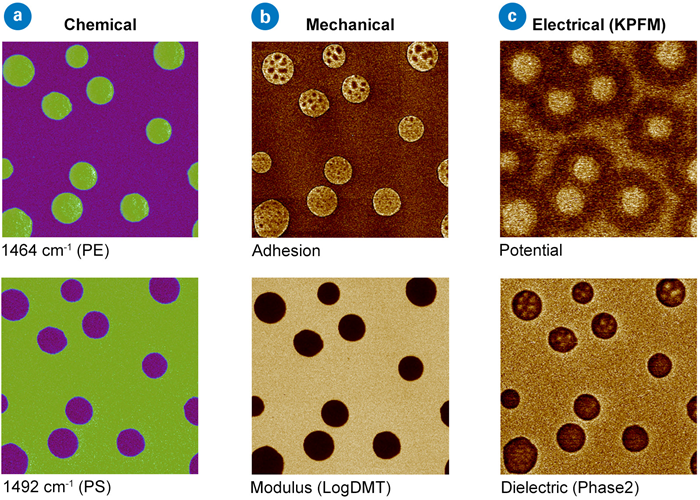
Figure 6. Correlative study of PS/LDPE, providing (a) chemical, (b) mechanical, and (c) electrical characterizations of the polymer blend. Scan sizes 5x5 μm. Image Credit: Bruker Nano Surfaces and Metrology
AFM-IR Provides Valuable Nanoscale Information for Polymers
AFM-IR is a potent, noninvasive technology for determining chemical compositions and distributions at the nanoscale. This focused characterization provides important information about the macro properties and functionalities of polymeric materials.
AFM-IR measurements provide valuable information for enhancing existing polymer production methods and finding and inventing new, useful polymers.
When paired with other AFM modes, AFM-IR allows for key correlation investigations of the chemical, mechanical, thermal, and electrical properties of polymers.
Authors
References
- Dazzi, A., et al. (2005). Local infrared microspectroscopy with subwavelength spatial resolution with an atomic force microscope tip used as a photothermal sensor. Optics Letters, 30(18), p.2388. https://doi.org/10.1364/ol.30.002388.
- Hamadeh, A., et al (2023). Toward conformational identification of molecules in 2D and 3D self-assemblies on surfaces. Communications Chemistry, (online) 6(1). https://doi.org/10.1038/s42004-023-01036-8.
- Hikaru Yabuta, Cody, G.D., et al. (2023). Macromolecular organic matter in samples of the asteroid (162173) Ryugu. Science, 379(6634). https://doi.org/10.1126/science.abn9057.
- Li, Y., et al. (2024). Identification and quantification of nanoplastics (20–1000 nm) in a drinking water treatment plant using AFM-IR and Pyr-GC/MS. Journal of hazardous materials, 463, pp.132933–132933. https://doi.org/10.1016/j.jhazmat.2023.132933.
- Tang, F., Bao, P. and Su, Z. (2016). Analysis of Nanodomain Composition in High-Impact Polypropylene by Atomic Force Microscopy-Infrared. Analytical Chemistry, 88(9), pp.4926–4930. https://doi.org/10.1021/acs.analchem.6b00798.
- Büttler, J.R., Bechtold, T. and Pham, T. (2020). Investigation of Interfacial Diffusion in PA/PP-g-MAH Laminates Using Nanoscale Infrared Spectroscopy. Langmuir, 36(33), pp.9886–9893. https://doi.org/10.1021/acs.langmuir.0c01447.
- Ural, M.S., et al. (2022). Quantification of drug loading in polymeric nanoparticles using AFM-IR technique: a novel method to map and evaluate drug distribution in drug nanocarriers. The Analyst, (online) 147(23), pp.5564–5578. https://doi.org/10.1039/d2an01079h.
- Brütting, C., et al (2023). Sustainable Immiscible Polylactic Acid (PLA) and Poly(3-hydroxybutyrate-co-3-hydroxyvalerate) (PHBV) Blends: Crystallization and Foaming Behavior. ACS Sustainable Chemistry & Engineering, 11(17), pp.6676–6687. https://doi.org/10.1021/acssuschemeng.3c00199.
- Guo, M., et al. (2021). Toroidal polar topology in strained ferroelectric polymer. Science, 371(6533), pp.1050–1056. https://doi.org/10.1126/science.abc4727.
- Zhao, S., et al (2024). Investigation of the influence of aluminum surficial water on aluminum-plastic hybrids through a combined experimental and simulation approach. Applied Surface Science, 656, pp.159694–159694. https://doi.org/10.1016/j.apsusc.2024.159694.

This information has been sourced, reviewed and adapted from materials provided by Bruker Nano Surfaces and Metrology.
For more information on this source, please visit Bruker Nano Surfaces and Metrology.