The modification of surfaces to influence subsequent molecular interactions represents a powerful technique, with researchers often adding functional groups that specific molecules can bind to in order to manage how enzymes, antibodies, DNA, bacteria, and viruses interact with a specific surface.1
This technique is generally referred to as ‘surface modification’ or ‘functionalization,’ and it is routinely applied in diverse industries such as tissue engineering, biosensors, biotechnology, and the semiconductor industry.
The central assumption of this process is that functional groups must form a monolayer to ensure experimental success. This is because the surface’s chemical state ultimately determines its interactions with other molecules.
Unsuccessful functionalization or the presence of contaminants has the potential to introduce confounding variables, making it especially difficult to troubleshoot unanticipated experimental outcomes.
Analytical techniques’ ability to rule out surface modification of the substrate as the cause of any subsequent issues is, therefore, extremely valuable.
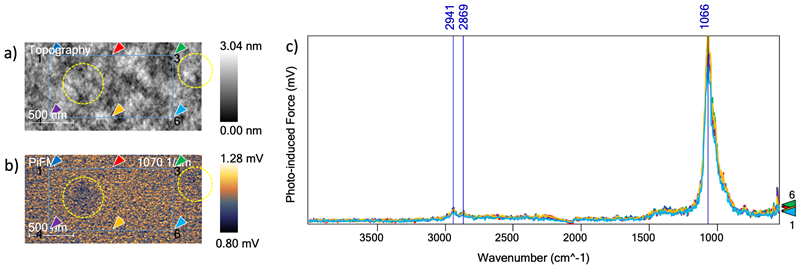
Figure 1. a) topographical results of the bare substrate show the physical features at a 2 μm x 1 μm scale. b) PiFM image at 1070 cm−1 the chemical signature of glass. Spectra were taken at the locations indicated by the arrows. c) The six spectra acquired at the locations in the previous figure are shown in this graph. Image Credit: Molecular Vista
Analytical Techniques for Monolayers
Understanding the state of a modified surface is essential, but there are ongoing challenges associated with nanoscale characterization using advanced microscopy and spectroscopy techniques.
The ideal technique would be non-destructive and operable in ambient conditions while also offering high spatial resolution, monolayer sensitivity, and the ability to detect monolayer gaps.
Popular techniques for this type of analysis include ToF-SIMS and XPS. ToF-SIMS is a destructive process, however, and while XPS is surface sensitive, this method requires an unwieldy vacuum environment. Both techniques are also insufficient in terms of their spatial resolution.
Water contact angle is a common choice, offering a convenient success indicator. However, its inability to identify specific surface molecules can lead to a false perception of success.
IR-PiFM is ideally suited for use in these types of applications. PiFM’s sub-5 nm spatial resolution and sub-monolayer sensitivity mean that it can be used to precisely measure the IR absorption of organic and inorganic surfaces. It excels in characterizing unprocessed and functionalized surfaces.2
This effectiveness is illustrated by two surface modification case studies, both of which see IR-PiFM successfully confirm the presence of monolayers and elucidate their underlying surface interactions.
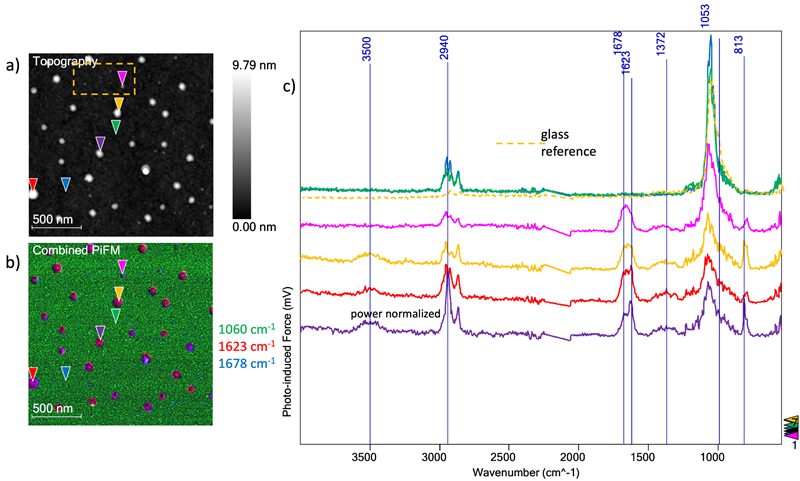
Figure 2. a) Aminosilane coated glass substrate topography. b) combined PiFM image. c) six spectra acquired on locations indicated by triangles in the images along with the averaged bare glass spectrum. Image Credit: Molecular Vista
Case Study 1: Aminosilane Glass Functionalization
Objective
Molecular Vista was contacted by a group looking to use aminosilane to functionalize glass substrates to check the quality of the group’s coating processes. This material is quite popular throughout the industry, with various organizations using similar commercially available substrates.
PiFM was used to check the group’s prepared samples before and after functionalization.
Results
A 2 µm x 1 µm topographical image of the bare glass substrate was acquired (Figure 1A). A PiFM image was generated using the chemical signature of glass (1070 cm−1), providing a map of the chemical composition across the surface (Figure 1B).
Six PiF-IR spectra were acquired at the points indicated in the images in Figures 1A and 1B. These spectra represented the IR spectra of the molecular species found at each location, offering vital insight into the state of the allegedly bare surface. The spectra also exhibited consistent repeatability (Figure 1C).
The topography image suggests the presence of height variations with longer spatial range, though most of these are not represented in the PiFM image due to the surface being chemically identical.
Variations were found in the PiFM image where the PiF signal was slightly lower. These variations (shown in yellow dashed circles) are probably due to a slightly thicker intervening contaminant layer between the tip and the glass substrate.
The small peaks located at ~2900 cm−1 correlate to the C-H stretch modes at 2941 cm−1 and 2869 cm−1, while peaks located at ~1400 cm−1 correlate to the C-H bending modes. These peaks indicate that the whole surface is covered with an ultrathin layer of organic contaminant.
Table 1. Summary of Infrared Spectra Peaks for Different Locations on the Surface. Source: Molecular Vista
| Location |
Spectrum Color |
Key Peaks |
| Bare Substrate |
Dark Blue, Green |
1060 cm−1 (glass), 2900 cm−1 (contaminant) |
| Short Aggregate |
Pink |
1623 cm−1 (NH2 Scissoring), 1678 cm−1 (unknown), 813 cm−1 (NH2 wagging mode) |
Tall Aggregates
(Red, Gold, Purple) |
Red, Gold, Purple |
1623 cm−1 (NH2 Scissoring), 1678 cm−1 (unknown), 813 cm−1 (NH2 Wagging mode), 3500 cm−1 (NH stretch) |
In this instance, PiFM successfully revealed the complexities beneath the outward simplicity of ‘bare’ materials.
A glass substrate functionalized with aminosilane was also analyzed in order to compare this to the first sample of bare glass. Figure 2A shows the initial 2 µm x 2 µm image of topography, allowing a combined PiFM image (Figure 2B) to be generated from the composite of three PiFM images at 1060 cm−1 (glass), 1623 cm−1, and 1678 cm−1.
The six spectra from Figure 1C were then averaged and displayed as a dashed spectrum (Figure 2C) for comparison purposes. Six PiF-IR spectra acquired at points indicated in the images on the aminosilane-coated glass substrate were also included.
Using a combination of the topography and PiFM image, it was possible to observe that the aminosilane molecules had aggregated into clusters rather than forming a monolayer assembly.
The topography featured in Figure 2A displays aggregates of different sizes on the surface. Six spectra were acquired to understand what was present on both the glass substrate and in these islands.
Two spectra (dark blue and green) were captured on the bare substrate, ensuring these were acquired away from the aggregates. These spectra reveal the primary glass peak at ~1060 cm−1, confirming that the majority of the surface is pure glass. The previously identified contaminant peaks at ~2900 cm−1 (C-H stretches) are also visible.
The remaining four spectra each correspond to a specific aggregate (pink, red, gold, and purple in Figure 2B and Figure 2C). These spectra feature prominent peaks at ~1623 cm−1 (NH2, scissoring), ~1678 cm−1 (unknown), and a peak at 813 cm−1 (NH2 wagging mode).
The three taller aggregates also have a broad peak at 3500 cm−1 (NH stretch). These three aggregates feature a relatively prominent peak at 1623 cm−1 compared to the shortest aggregate, represented by the pink spectrum. Table 1 summarizes these results.
The presence of these amine groups confirms that these are aminosilane aggregates. Molecular Vista more closely investigated these islands in a 600 nm x 300 nm region (Figure 2A, dashed gold rectangle). Figure 3 shows the result of this investigation.
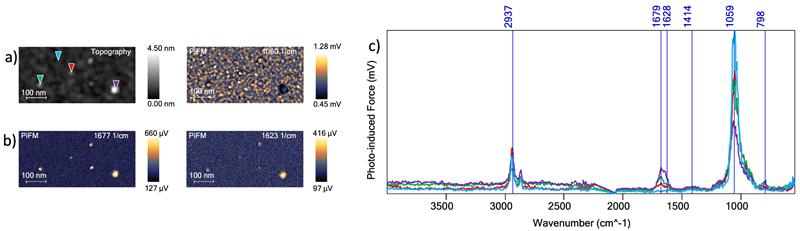
Figure 3. a) 600 nm x 300 nm region defined by the dashed golden rectangular box in Figure2A, topography and PiFM. b) PiFM images at 1060 cm−1, 1623 cm−1, 1677 cm−1. c) Four PiF-IR spectra acquired at the locations indicated by triangles in the topography image. Image Credit: Molecular Vista
The topographical image in Figure 3A also shows several smaller clusters with heights ranging from ~0.7 nm to ~1.4 nm (excluding the aggregate corresponding to the purple spectrum).
These heights are more useful estimates of cluster size because the tip radius will dilate the lateral dimensions. It is also possible to clearly see amine peaks on these small clusters due to PiFM’s high spatial resolution.
The red spectrum shown demonstrates PiFM’s exceptional sensitivity. This was acquired on a cluster that is just ~0.7 nm thick, most likely comprised of 5 to 10 molecules depending on their size.
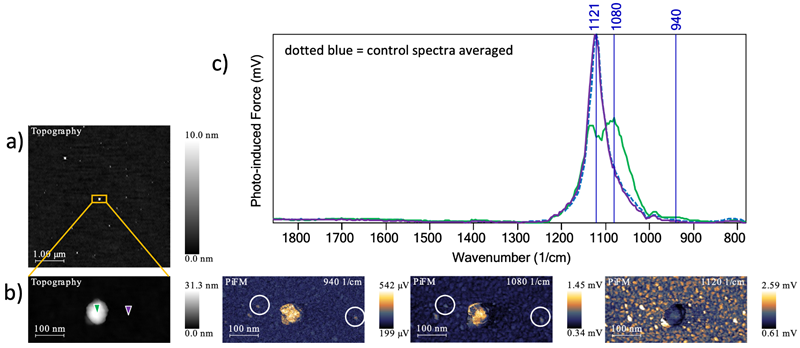
Figure 4. a) SiO2/Si treated with an epoxide-terminated methoxy silane topography. b) PiFM image and topography of zoomed in section. c) PiF-IR spectra. Image Credit: Molecular Vista
Both the spectra and the image suggest a stronger peak at 1679 cm−1 compared to 1628 cm−1 on these thinner clusters. This could be the result of molecules arranging themselves in a more ordered, two-dimensional layer.
PiFM is more sensitive to out-of-plane vibrations due to its tip orientation, allowing it to provide valuable clues about molecule alignment.
The light blue spectrum (Figure 2C) shows the glass peak and contaminant peaks but does not feature aminosilane signatures. This confirms that the majority of the surface is not covered by aminosilane.
This may be suitable for some applications, but the achievement of a more uniform monolayer can lead to considerable improvements in final products’ yield and reliability. Using a tool like PiFM to identify gaps in this monolayer could also help troubleshoot any issues with subsequent processes.
Case Study 2: Silicon Substrate Functionalization
Objective
An investigation was done into the application of an epoxide-terminated methoxy silane on a silicon substrate with native oxide. The goal of this work was an assessment of treatment uniformity using PiFM analysis.
Results
Figure 4A features a 5 µm x 5 µm topography revealing similar aggregates of molecules to Case Study 1.
The green spectrum in Figure 4C was collected at the location highlighted by the green marker shown in Figure 4B. This spectrum revealed additional peaks at 1080 cm−1 and 940 cm−1 versus the spectrum acquired on the substrate (purple spectrum).
The peaks at 1080 cm−1 and 940 cm−1 were attributed to Si-O-Si and Si-OH vibrations, respectively.3 PiFM images at these wavenumbers prominently highlight the aggregate. Fainter aggregates (white circles) with heights ~0.5 nm thick (not shown) most likely represent a monolayer or bilayer aggregate consisting of a few molecules.
These observations were found to be fairly consistent with the model proposed by Naik et al., who suggested that rather than forming a uniform monolayer (Figure 5A), silanes cluster into structures approximating snow moguls (Figure 5B). These clusters are believed to be held together by Si-O-Si linkages, with only a small number of the silane molecules attaching to the surface.
Naik et al. primarily attribute the cluster formation to internal strain within the silane molecules, suggesting that this results from the mismatch of alkyl-chain van der Waals radius and Si-O-Si bond distance. Molecular Vista believes the density of -OH bonds in relation to the cleanliness of the oxide surface also plays a significant role, however.
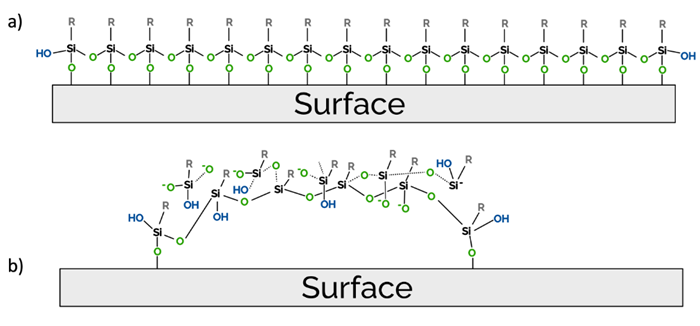
Figure 5. (a) Classical view of the silane-coated silicon oxide surface. (b) Proposed new model of silane-coated silicon oxide surface, adapted from Naik et al.4 Image Credit: Molecular Vista
Summary
Molecular Vista’s studies have shown that rather than forming the anticipated uniform monolayer, both treatments see molecules assemble into clusters across the substrate.
Therefore, significant portions of the surface are left bare, potentially affecting final product performance, which depends on interactions with functional groups.
Further research is required to better understand the factors governing cluster formation. This will be key to the development of a more uniform and potentially more reliable surface modification that is suitable for analysis via PiFM.
References and Further Reading
- Sonawane, M.D. and Nimse, S.B. (2016). Surface Modification Chemistries of Materials Used in Diagnostic Platforms with Biomolecules. Journal of Chemistry, (online) 2016, p.e9241378. https://doi.org/10.1155/2016/9241378.
- Nowak, D., et al (2016). Nanoscale chemical imaging by photoinduced force microscopy. Science Advances, 2(3). https://doi.org/10.1126/sciadv.1501571.
- Issa, A. and Luyt, A. (2019). Kinetics of Alkoxysilanes and Organoalkoxysilanes Polymerization: A Review. Polymers, 11(3), p.537. https://doi.org/10.3390/polym11030537.
- Naik, V.V., et al. (2013). Multiple Transmission-Reflection IR Spectroscopy Shows that Surface Hydroxyls Play Only a Minor Role in Alkylsilane Monolayer Formation on Silica. The Journal of Physical Chemistry Letters, 4(16), pp.2745–2751. https://doi.org/10.1021/jz401440d.

This information has been sourced, reviewed and adapted from materials provided by Molecular Vista.
For more information on this source, please visit Molecular Vista.