From SemplorReviewed by Olivia FrostNov 16 2026
This article is based on a poster originally authored by Dr. Ivan Lobato, Eric Toering, Dr. Serge Gavras, and Prof. Dr. Karel van der Mast from Semplor.
EDS spectra are made up of X-ray peaks superimposed on a Bremsstrahlung continuum. While the peaks provide information about their elemental composition, the continuum offers additional information linked to the local mean atomic number (Z) and specimen geometry.
At low counts, signal-dependent Poisson noise can mask weak spectral peaks and make quantitative spectral reconstruction more difficult.
Additional ambiguities can arise from detector physics, too. For instance, Silicon (Si) escape peaks occur 1.74 kiloelectronvolts (keV) below the parent lines, whereas pulse pile-up under high-count-rate conditions creates sum peaks at energies of E1+E2.
Typically, neither sequential denoising nor background subtraction can preserve the separated peak and continuum components, and they are also unable to resolve them at the detector stage.
Study Objective
The aims of this single physics-structured inverse problem were to:
- Denoise EDS spectra
- Separate characteristic peaks from the Bremsstrahlung background
- Compensate for Si escape and pulse pile-up
Study Method: Physics-Structured Targets and One Coupled Network
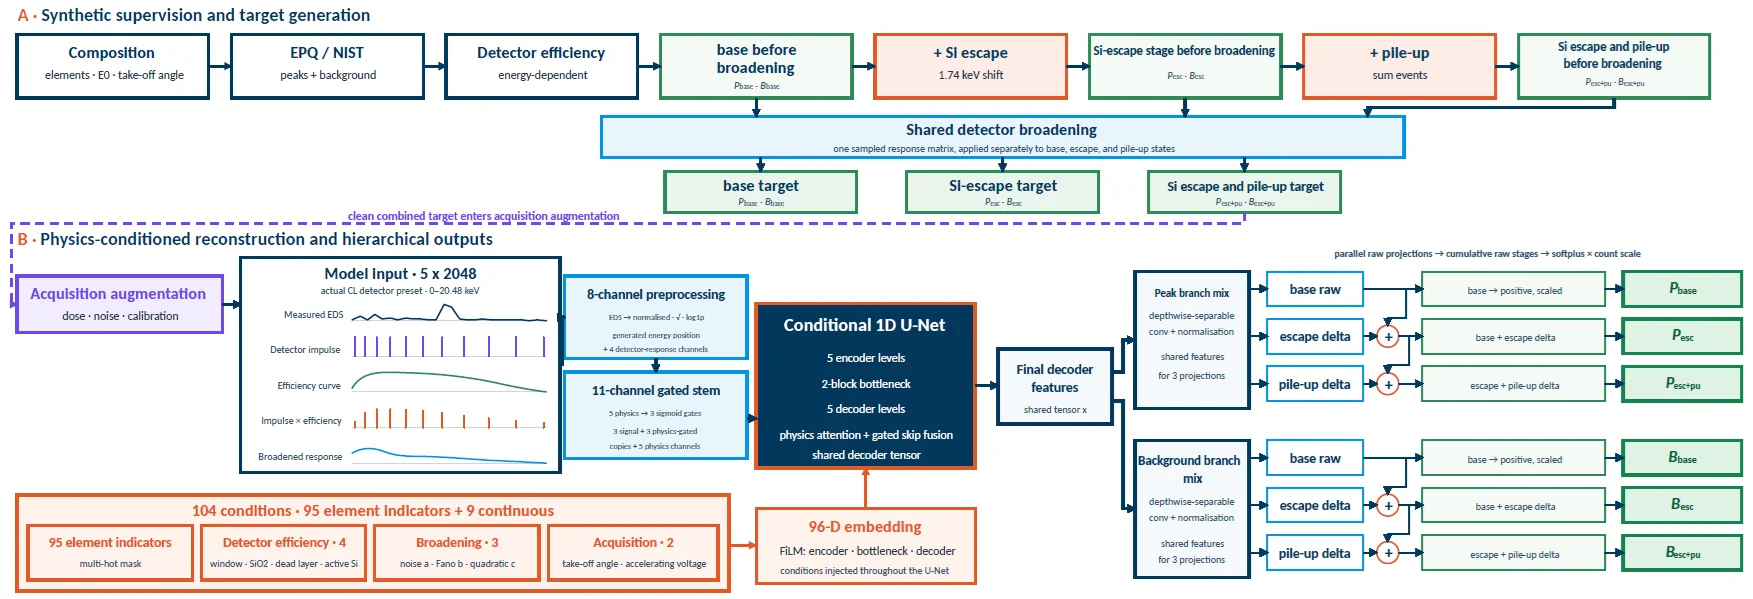
Image Credit: Semplor
Stage notation: P and B represent the peak and Bremsstrahlung components, respectively. Pbase/Bbase: Si escape and pile-up removed; Pesc/Besc: Si escape retained and pile-up removed; Pesc+pu/Besc+pu: both artifacts retained before stochastic acquisition augmentation.
Study Results
1. Fe2O3 Spectra Validate Low-Dose Reconstruction and Detector-Stage Separation
For measurements acquired at 20 kilovolts (kV) with a constrained count rate of two kilocounts per second (kcps) and a one-second (s) acquisition duration, the reconstructed spectra closely matched the high-count reference. The stage-resolved outputs located the Fe Kα Si-escape position and the Fe K pile-up region.
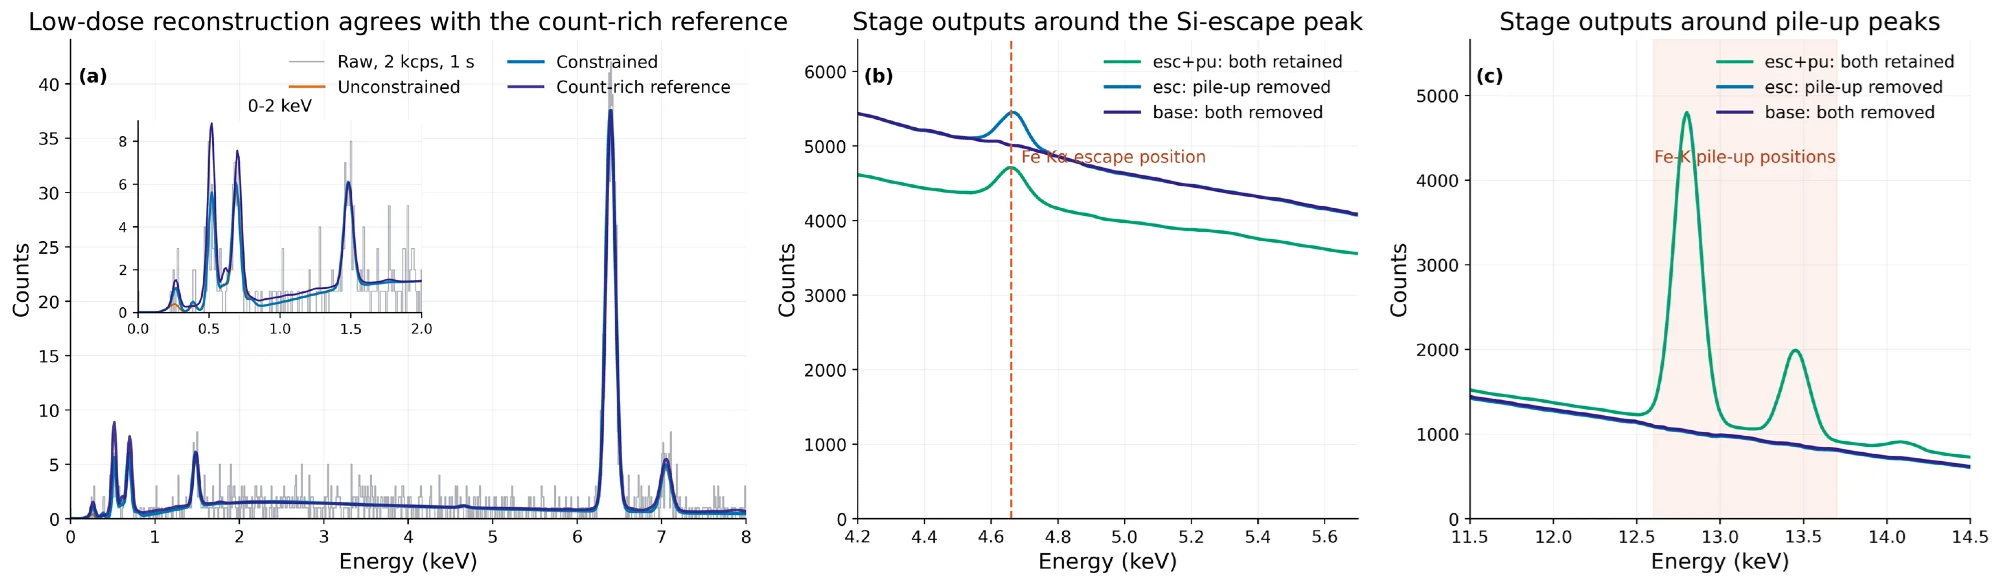
Image Credit: Semplor
2. Signal Separation Across the Thermite Spectral Image
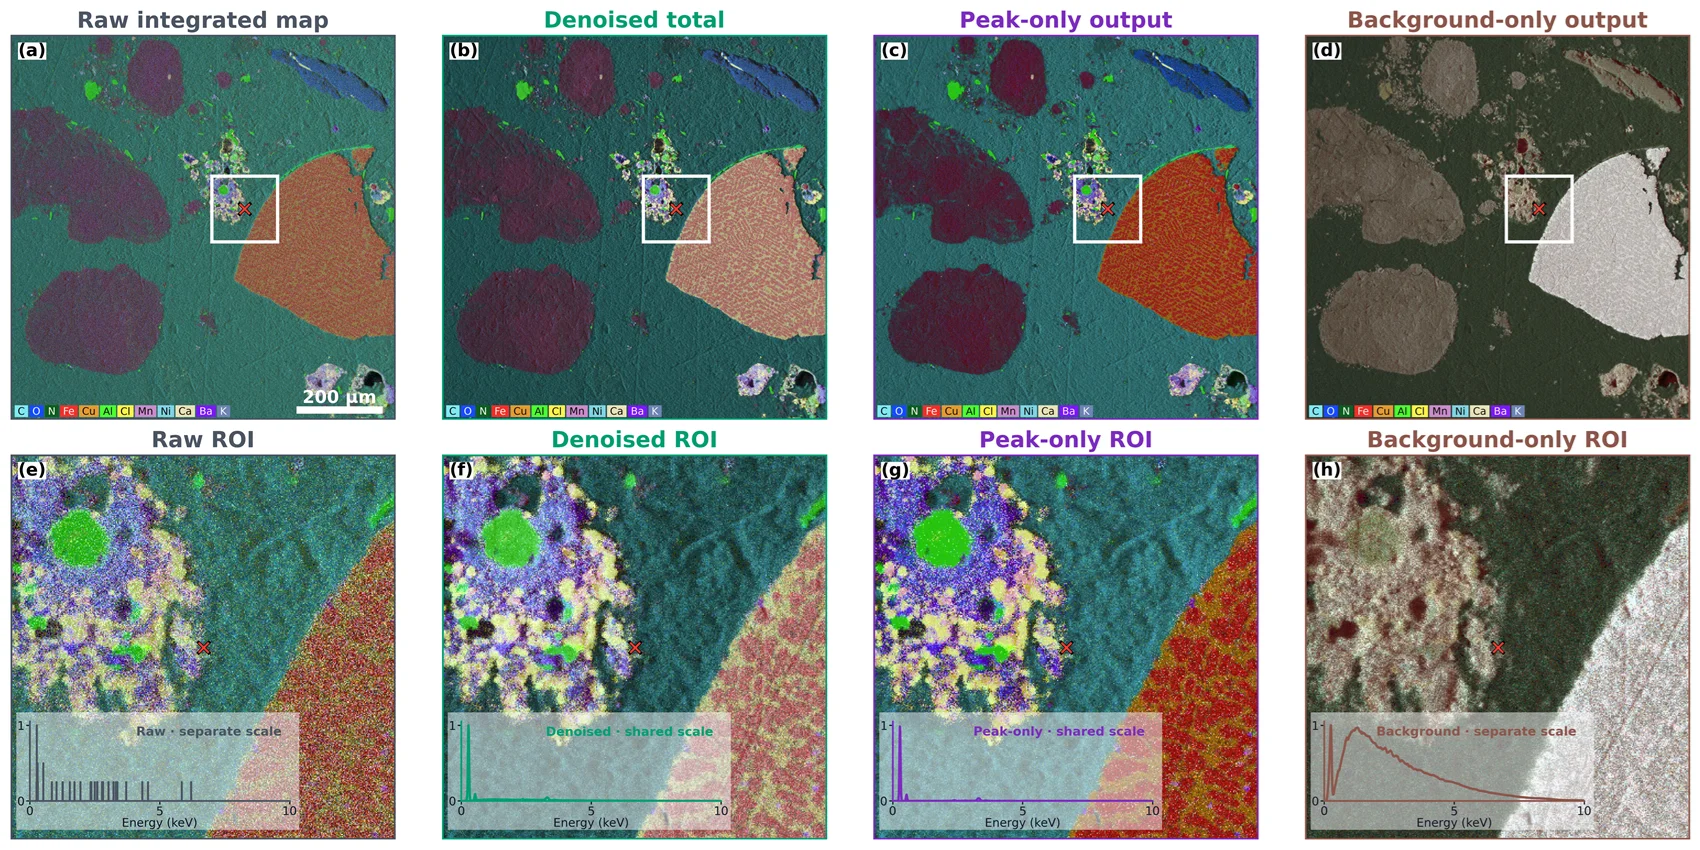
Image Credit: Semplor
Each column pairs a full-field map to its corresponding marked region of interest (ROI) and the spectrum from the central pixel. The denoised and peak-only insets shared the denoised-total scale. Raw-count and background traces were normalized separately to preserve the visibility of their spectral shapes.
Conclusions
The combination of physics-structured targets, staged losses, and a shared conditional network distinguished low-dose noise reduction from detector-artifact compensation. Plus, this framework is designed to accommodate different acquisition conditions and is not restricted to one set of conditions alone.
Two hierarchical branches generated six coupled outputs and recovered corresponding peak and background pairs at three cumulative physical stages. These stages included where both the Si escape and the pile-up were retained, the Si escape was retained, but the pile-up was removed, and where both artifacts were removed.
The Fe2O3 experiments covered complementary counting regimes. Conditioning improved the reconstruction stability at low doses, while constrained and unconstrained solutions converged as counts increased. At high count rates, stage differences revealed the Si-escape and pile-up structure.
Results from the thermite spectral image demonstrated a range of benefits of this approach. Denoising suppressed speckle, peak-only reconstruction enhances the compositional contrast, and the separated background preserves complementary mean-Z and morphological contrast. The model can facilitate inference under constraints, semi-constraints, and unconditional settings.
References and Further Reading
- Pouchou, J.-L. and Pichoir, F. (1991). Quantitative Analysis of Homogeneous or Stratified Microvolumes Applying the Model “PAP.” Electron Probe Quantitation, pp.31–75. DOI:10.1007/978-1-4899-2617-3_4. https://link.springer.com/chapter/10.1007/978-1-4899-2617-3_4.
- Ritchie, N.W.M. (2009). Spectrum Simulation in DTSA-II. Microscopy and Microanalysis, 15(5), pp.454–468. DOI:10.1017/s1431927609990407. https://academic.oup.com/mam/article-abstract/15/5/454/6919550.
- Schoonjans, T., et al. (2011). The xraylib library for X-ray–matter interactions. Recent developments. Spectrochimica Acta Part B: Atomic Spectroscopy, 66(11), pp.776–784. DOI:10.1016/j.sab.2011.09.011. https://www.sciencedirect.com/science/article/abs/pii/S0584854711001984.
- Ronneberger, O., Fischer, P. and Brox, T. (2015). U-Net: Convolutional Networks for Biomedical Image Segmentation. Lecture Notes in Computer Science, 9351, pp.234–241. DOI:10.1007/978-3-319-24574-4_28. https://link.springer.com/chapter/10.1007/978-3-319-24574-4_28.
- Semplor BV. NANOS tabletop SEM product information (2026).

This information has been sourced, reviewed, and adapted from materials provided by Semplor.
For more information on this source, please visit Semplor.