Dynamic light scattering (DLS) is a technique used for particle sizing of samples, typically in the sub-micron range. The technique measures the time-dependent fluctuations in the intensity of scattered light from a suspension of particles undergoing random, Brownian motion. Analysis of these intensity fluctuations allows for the determination of the diffusion coefficients, which in turn yield the particle size.
Conventional Dynamic Light Scattering Measurements
Conventional DLS instruments use a detection angle of 90°. The concentration limit of instruments using such optics is very low, as multiple scattering effects need to be eliminated. Multiple scattering is a phenomenon where light scattered by one particle will itself be scattered by another. The consequence of multiple scattering is to reduce the apparent particle size and the intercept value (the signal to noise ratio). The measured particle size should be independent of the sample concentration.
The Advantage of Non-Invasive Backscatter Detection
The path length over which the scattered light has to pass out of the sample is significant in a conventional 90° DLS instrument. One way of removing multiple scattering effects is to reduce the path length of the scattered light. This can be achieved by using backscatter optics. The Zetasizer Nano S uses non-invasive backscatter detection (NIBS), which allows for much higher concentrations to be measured compared to conventional DLS instruments.
The Effect of Particle/Particle Interactions
One other phenomenon which will influence the diffusion speed of particles (and hence the particle size obtained) is the onset of particle/particle interactions. If these interactions are present, it may be that DLS cannot be used as an accurate particle sizer, but can still be used as a monitor of changes in particle size.
Pigments
Pigments are used in a variety of applications ranging from cosmetics and paints to food and pharmaceuticals. They may be organic (toners or carbon black) or inorganic (metal powders or metal oxides). The particle size of pigments is critical in determining many of the properties of the products in which they are used. Opacity, colour, hue, tinting strength, gloss, durability and sample viscosity are all dependent upon the particle size. Particle size reduction of pigments can occur using a high shear mixer running in batch operation, or in a continuous operation using in-line high shear mixers, mills or pumps.
Aggregation and Concentration
Particle size measurement is a very important part of determining product quality. However, most of the sizing techniques available involve large dilutions of the sample prior to measurement. Such large dilutions may change the morphology of the sample. For example, aggregates present in the concentrated sample, may disperse upon dilution. The ability to measure the sample at a concentration at or as close to the original sample concentration is very desirable. The use of NIBS optics allows for such measurements to be made.
The Effect of Milling
This application note summarises measurements made on a series of pigment samples taken from a milling process at various times to illustrate the ability of the Zetasizer Nano as a particle size monitor at high concentrations.
Experimental
Sample Preparation
Blue pigment samples were taken from a bead mill at 1-hour intervals. These samples were at a concentration of 15% w/v. Even though the samples could be measured at these neat concentrations, particle/particle interaction effects made it difficult to interpret the results. The samples were therefore diluted 1 in 10 with filtered, deionised water. These diluted samples (1.5% w/v) were very opaque but this small dilution eliminated the particle/particle interactions. Figure 1 shows 3 cuvettes containing (A) the pigment sample as received 15% w/v, (B) the sample as measured 1.5% w/v and (C) the sample diluted to 0.0015% for measurement on a conventional 90° DLS instrument.
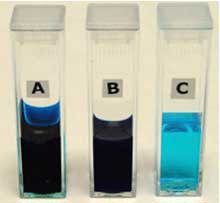
Figure 1. Photograph showing 3 cuvettes containing (A) the pigment as received at 15% w/v, (B) the sample as measured 1.5% w/v and (C) the sample diluted to 0.0015% for measurement on a conventional 90° DLS instrument.
Particle Size Measurements
All the samples were measured on a Zetasizer Nano S at 25°C. The instrument contains a 4mW He-Ne laser (operating at a wavelength of 633nm) and the measurements were made at a detection angle of 173° (i.e. backscatter). The measurement position within the cuvette was automatically determined by the software and was always found to be near the wall of the cuvette indicating that the sample was very turbid. At least 3 measurements on each sample were taken to check for repeatability.
Results and Discussion
Table 1 summarises the results obtained from the measurements of the blue pigment samples taken from the mill at 1-hour intervals and diluted 1 in 10 with filtered deionised water. The results shown are the average of 3 repeat measurements. The repeatability of the data is shown by the standard deviation values calculated from the repeat measurements (shown in brackets). The z-average diameter and polydispersity index values are calculated from the cumulants analysis as described in the International Standard on DLS ISO13321. The z-average diameter is the mean diameter based on the intensity of scattered light and is sensitive to the presence of aggregates and/or large particles. Therefore, monitoring of the progress of the milling of a product can be achieved by following the gradual decrease in the z-average diameter until a constant value is obtained.
Table 1. Results obtained for a blue pigment removed at different time intervals from a mill diluted 1 in 10 with DI water. The z-average diameters and polydispersity index values obtained from three repeat measurements are shown together with the standard deviations (in brackets).
|
Sample
|
z- Average Dia in nm (SD)
|
Polydispersity Index (SD)
|
|
Mill Start Up
|
310.5 (9.2)
|
0.576 (0.04)
|
|
Removed after 1 hour
|
179.0 (0.7)
|
0.268 (0.01)
|
|
Removed after 2 hours
|
172.4 (0.8)
|
0.247 (0.01)
|
|
Removed after 3 hours
|
173.1 (1.8)
|
0.345 (0.02)
|
|
Removed after 4 hours
|
154.1 (1.1)
|
0.256 (0.01)
|
|
Removed after 5 hours
|
149.9 (1.3)
|
0.251 (0.01)
|
The Effect of Milling Time on Particle Size
The results are plotted in figure 2 and show that the milling of the pigment can be monitored successfully using dynamic light scattering at very high concentrations with little sample dilution required. Figure 2 shows that the product size decreases markedly over the first hour of milling, but then the size reduction slows down over the remaining milling time.
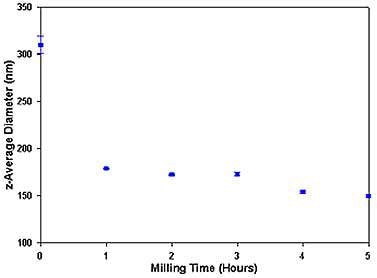
Figure 2. A plot of the z-average diameter (in nm) as a function of the milling time (in hours). The graph contains error bars which are the standard deviations obtained from the repeat measurements of each sample.
Accuracy and Repeatability of Measurements
The z-average diameter and polydispersity index values obtained for the sample removed after 3 hours of milling are not consistent with the other results. The polydispersity index value in particular shows a value greater than the results obtained at 1 and 2 hour milling times. These results were checked by measuring other preparations of the samples and were found to be repeatable. Even further dilutions of the samples gave consistent results to those contained in table 1. Figure 2 contains error bars, which are the standard deviations, obtained from the repeat measurements of each sample. The small error bars exemplify the repeatability of the measurements.
Particle Size Distribution as Function of Milling Time
Figures 3 and 4 show the intensity size distributions obtained at the start of the milling process and after 5 hours. The size distribution at mill start up shows the presence of large particles in the micron size range (figure 3). After 5 hours of milling, a monomodal size distribution is obtained where the large particles have been removed (figure 4). In addition, the lower size limit of the distribution has been reduced from around 60nm (at mill start up) to around 45 nm (after 5 hours of milling).
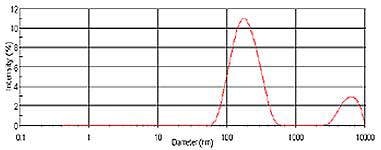
Figure 3. Intensity size distribution of pigment taken at mill start up and diluted 1 in 10 with DI water.
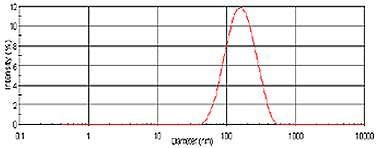
Figure 4. Intensity size distribution of pigment taken after 5 hours of milling and diluted 1 in 10 with DI water.
Conclusions
The results detailed in this application note show that monitoring of milling processes can be successfully achieved using dynamic light scattering at concentrations which are near to the neat sample.
The Zetasizer Nano with NIBS optics can measure the size of very concentrated samples. This ability improves the ease of sample preparation and makes the Zetasizer Nano an easy to use instrument in a quality control environment.

This information has been sourced, reviewed and adapted from materials provided by Malvern Panalytical.
For more information please visit Malvern Panalytical.