If particles of a definite size must be produced it is important that the sample size and shape monodispersity is known. A high-resolution method, such as Transmission Electron Microscopy (TEM), is often used for this measurement.
An example of this application would be Particle Works (part of Blacktrace Holdings Ltd) who produce gold nanoparticles with little variation between batches (of 2.5% maximum) and a high monodispersity, with a size distribution of CV = 5%.
Particle Works use TEM for their quality control analysis despite the technique being expensive, requiring specialized operation and taking a lot of time to run. For these reasons, Particle Works wanted to try using the Zetasizer Ultra to see if they could replace TEM.
The Zetasizer Ultra can quickly provide a wealth of information on the characteristics of particle samples. The instrument collects this data using Depolarized Dynamic Light Scattering (DDLS), Multi-Angle Dynamic Light Scattering (MADLS) and Adaptive Correlation.
In the following example, gold nanoparticles from Particle Works were analyzed using Multi-Angle Dynamic Light Scattering (MADLS) with the Zetasizer and TEM for quality control purposes.
Method
The samples tested were Particle Work’s gold nanoparticles, produced during their development of their new product range - Ultraspherical Gold Nanoparticle.
The Zetasizer Ultra was used to measure particles with target sizes of 10, 15, 20 and 50 nm in DTS0012 plastic cuvettes. TEM was also used to measure the samples, with at least 100 particle measurements for each target size category. Table 1 (below) shows these sample categories.
Table 1. Sample details including target size
| SAMPLE NAME |
TARGET SIZE (nm) |
| Au-2-016-7 |
10 |
| Au-2-016-13 |
15 |
| Au-2-17-6 |
20 |
| Au-2-037-4 |
50 |
| Au-2-041-3 |
50 |
Results
For every sample measured the Zetasizer measurements showed a greater Peak by Intensity than the TEM measurements. This is the result of gold having a greater hydrodynamic radius due to associated hydration layers, coordinated ligands and ionic surfactants. Zetasizer measures the total hydrodynamic radius whereas TEM measurements measure only the diameter of the particle itself.
DLS measurement of 10 nm sample (Au-2-016-7) found that the size populations were greater than the 10 nm target, to such an extent that the distribution (Figure 1) does not show a peak at the 10 nm target. For this reason, it is unlikely that the sample Au-2-016-7 meets its specification.
The results from the TEM concluded that there are many large particles, but there are also 10 nm target particles present. It is possible that these smaller particles are not present in the MADLS measurement due to masking from scattering of the larger particles.
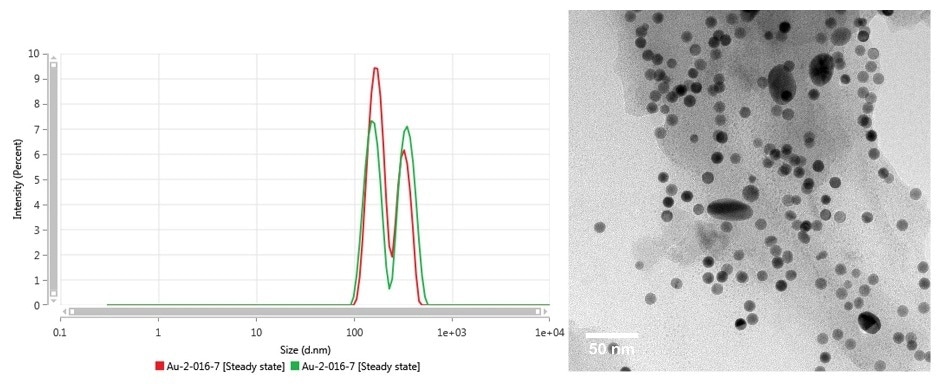
Figure 1. Intensity size distribution (left) as measured by MADLS and TEM (right) of Au-2-016-7
MADLS measurement of the 15 nm target sample (Au-2-017-6) indicated that the sample fits its 15 nm specification with a narrow size distribution (Figure 2). The TEM images disagreed with this conclusion due to the identification of some particles that were smaller than the target size, meaning the sample did not fit the specification.
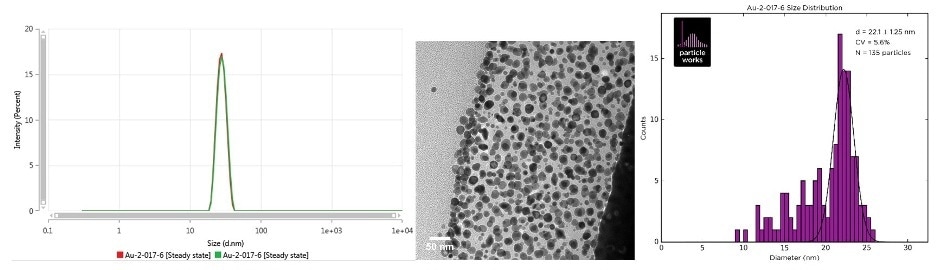
Figure 2. Intensity size distribution as measured by MADLS (left), TEM image (center) and the TEM size distribution (right) of Au-2-017-6
MADLS was unable to identify this because particle scattering shows bias towards the larger particles, hiding the presence of the smaller particles. This demonstrates that whilst MADLS can be used to detect the particles that constitute the bulk of a sample, it is less proficient at identifying samples outside of the bulk.
TEM analysis of the 20 nm target sample (Au-2-17-6, Figure 3) found that the particles fit the specification and had a uniform size distribution. Despite this, the TEM images also showed rings around the particles and it was unknown if the rings were a consequence of the way they were dried, or a more accurate depiction of the particle size.
DLS measurements were used to test this. The DLS results showed a small narrow distribution, whereas this would be wide and tall if the rings were part of the particles. It was therefore concluded that during particle drying surfactant had dried around the particles, leaving the rings observed in the TEM. This conclusion means that the particles fit the specification and are fit for sale.
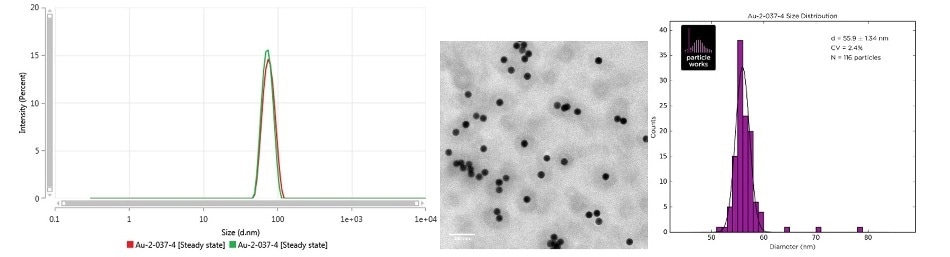
Figure 3. Intensity size distribution as measured by MADLS (left), TEM image (center) and the TEM size distribution (right) of Au-2-037-4
MADLS was used to measure the first 50 nm target sample (Au-2-041-3, Figure 4), which showed a majority uniform distribution but with an unusual small peak in the region below 10 nm.
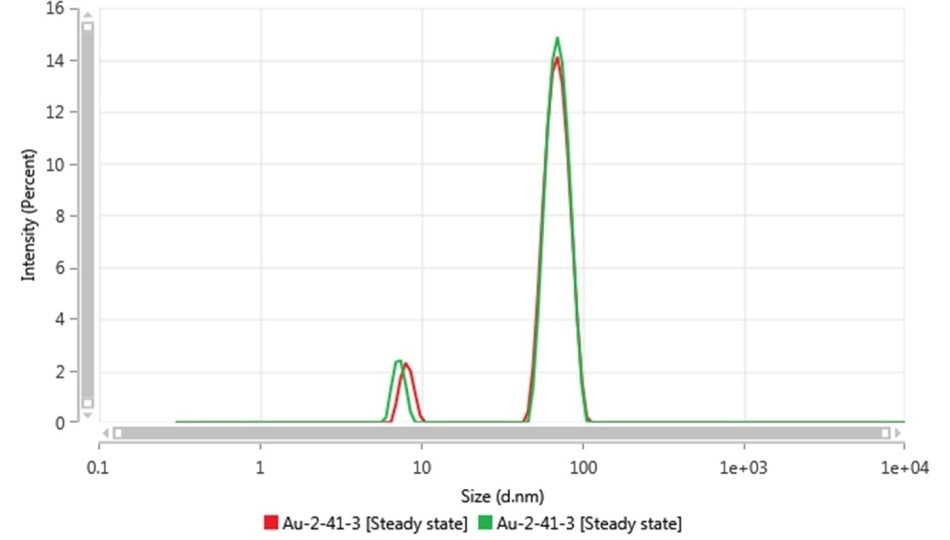
Figure 4. Intensity size distribution as measured by MADLS of Au-2-041-3
With an unexpected peak such as this it can be useful to use the DDLS capabilities on the Zetasizer Ultra. By removing the vertically-polarized scattered light, leaving just the horizontal-polarized scattered light, it can be determined whether this unexpected peak is due to translational diffusion of particles and therefore another population present in the sample. Alternatively, this peak could also be due to the rotational diffusion of a non-spherical particle, if so, then the <10 nm peak would be expected to increase in relative intensity compared to the larger size peak when using horizontal polarisation.
Backscattering measurements using vertically and horizontally polarized light were taken (Figure 5). The vertical measurement showed similar results to the original measurement, whereas the horizontal measurement showed a shift in peak height for the smaller peak. This means the small peak below 10 nm is not the result of particle translation diffusion but instead due to the presence of non-spherical particles.
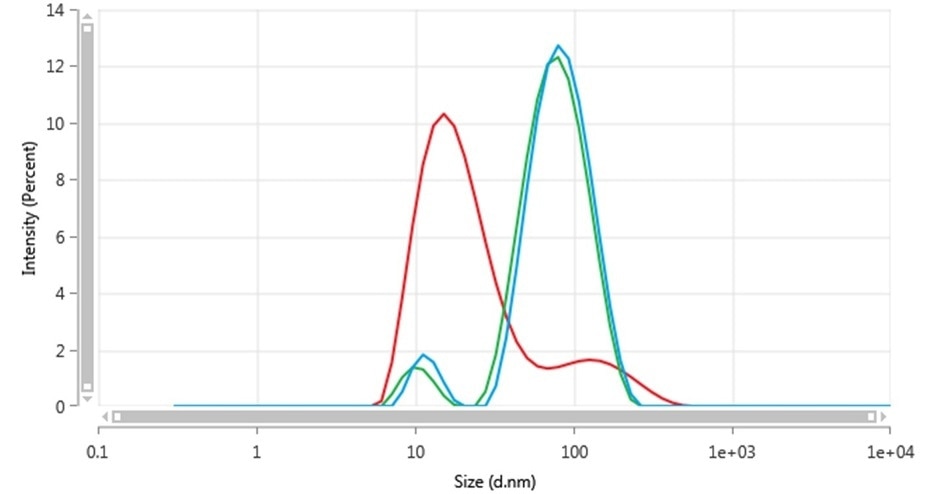
Figure 5. Intensity size distributions of Au-2-041-3 in backscatter using all polarizations (blue), vertical polarization (green) and horizontal polarization (red)
Analysis of TEM images of the sample (Figure 6) supported this conclusion. The TEM images displayed particles with facetted structures, and also particles with rod-like structures. It is suspected that the rod-like particles are responsible for the sub 10 nm peak in the DLS results.
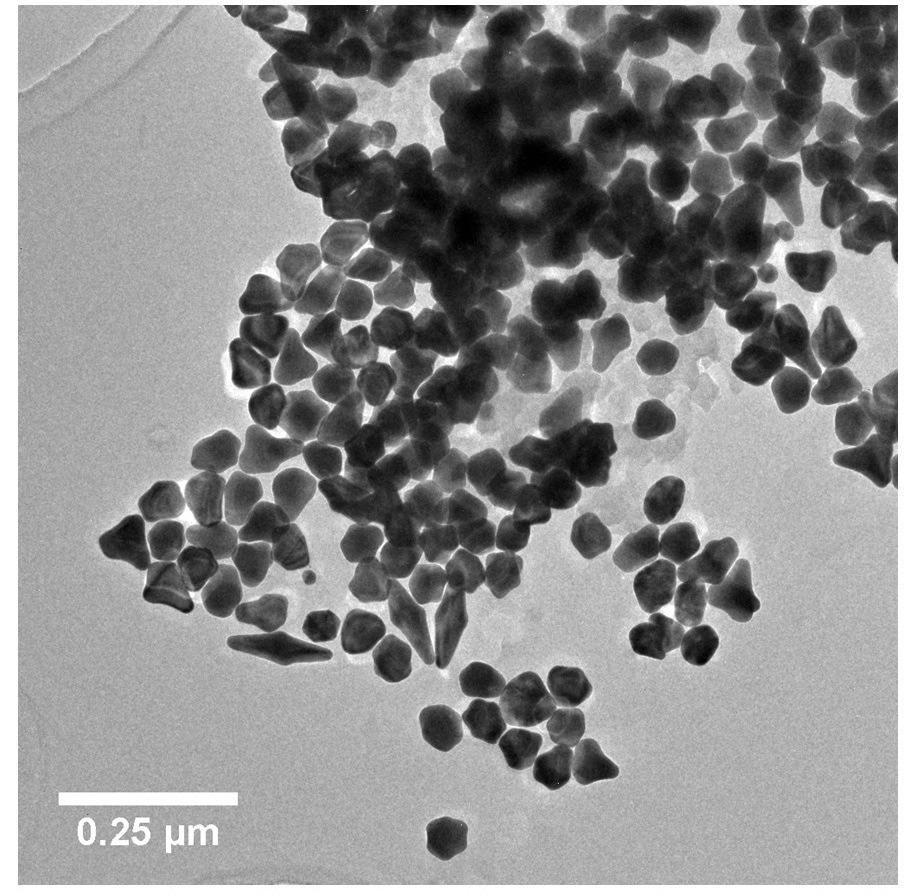
Figure 6. TEM image of Au-2-041-3
MADLS measurement of the second 50 nm target sample (Au-2-016-13, Figure 7) determined that it had a narrow distribution and a monomodal constitution. This indicates that the sample fits its specification, and TEM data, which indicated a uniform size, confirms this. These conclusions mean the sample is fit for sale.
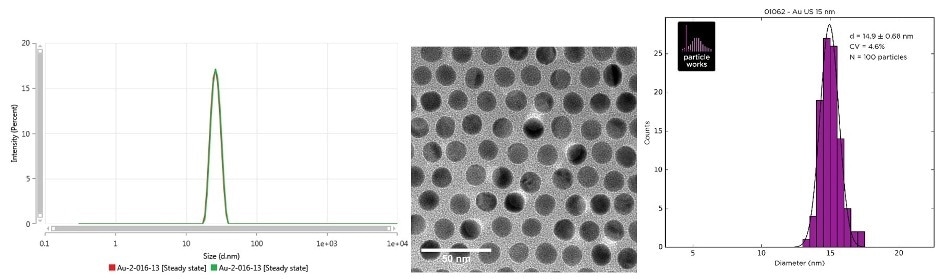
Figure 7. Intensity size distribution as measured by MADLS (left), TEM image (center) and the TEM size distribution (right) of Au-2-016-13
Conclusion
As demonstrated, the Zetasizer Ultra is a fantastic instrument for quality control at both research and manufacturing stages. It is easy to rapidly take measurements allowing the analysis of many different samples to determine if they meet specifications.
In this research using the Zetasizer meant TEM had to be used less frequently, with the Zetasizer identifying just as many off-specification samples as the Zetasizer Ultra.

This information has been sourced, reviewed and adapted from materials provided by Malvern Panalytical.
For more information on this source, please visit Malvern Panalytical.