Sponsored by HORIBAAug 16 2005
Single-wall carbon nanotubes (SWNTs), consisting of rolled-up single sheets of carbon atoms, have received much attention recently. SWNTs are known to emit in the IR region, and their emission can be used to characterize their diameter and other structural properties. The NanoLog™ (see figure 1), the modular spectrofluorometer from HORIBA, is designed with near-IR detectors and a TRIAX spectrometer for efficient spectral analysis of SWNT emission.
Near-IR detectors available include both liquid-N2-cooled Symphony series of InGaAs arrays (see figure 2), which can take a full spectrum rapidly, as well as economical single-element InGaAs detectors. These detectors are sensitive to photons from 800–1700 nm, with optional detection to longer wavelengths. In addition, for extra sensitivity and time-resolved measurements, a near-IR-sensitive photomultiplier-tube may be used as the detector.
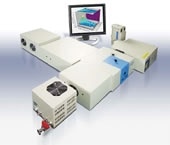
Figure 1. NanoLog™ spectrofluorometer from HORIBA.
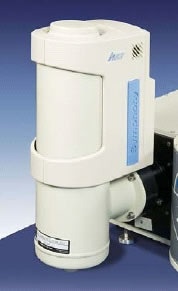
Figure 2. Symphony InGaAs array, the standard detector on the NanoLog™.
Recording the Fluorescence Spectra from Single Wall Carbon Nanotubes (SWNTs) - Description of the Experimental Process
Fluorescence spectra from high-pressure-CO SWNTs (in aqueous 1% sodium dodecyl sulfate) were recorded using a NanoLog™, incorporating a double-grating excitation monochromator (600 grooves/mm, blazed at 1000 nm) and TRIAX emission spectrograph (150 grooves/mm, blazed at 1200 nm) for emission. To detect the nanotubes’ fluorescence, a Symphony-series near-IR InGaAs CCD-array (512 pixels × 1” [2.54 cm], liquid-N2 cooled) was used, with 2 s integration time per emission scan. The slit-width was 4 mm on both excitation and emission. The step size was 2 nm between points for each scan. Excitation was scanned from 620–815 nm; emission was scanned from 1080–1356 nm. Photoluminescence intensity was measured as (signal - dark counts)/reference. The total acquisition time for the data was about 10 min.
The Results that Emerged from this Experiment
A 3-D excitation-emission matrix scan (see figure 3) of the entire near-IR spectral region of interest shows an overview of the fluorescence characteristics of the SWNT mixture. The chirality of each species is given by its (n,m) coordinates. The simulation and assignment of spectral peaks provided by HORIBA’s NanosizerTM software package is presented in figures 3 and 4 (see below). In figure 3, the upper flat plot includes white contour lines from a simulated spectrum. Assignment of the peaks is shown in figure 4; the diameter and chiral angle of rolling-up of the nanotubes is related to the wavelength of the emission peaks.
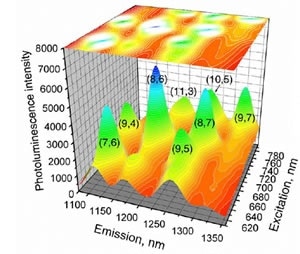
Figure 3. Emission-excitation matrix scan of a mixture of SWNTs recorded with the NanoLog™. Chirality of each species is presented as (n,m). The white lines on the upper surface of the “cube” are from a simulation of the same matrix performed by the Nanosizer™ software.
Figure 4. Analysis, in chiral-map format, by the Nanosizer™ of a mixture of SWNTs recorded with the NanoLog™ in figure 3. Chirality of each species is presented as (n,m). The diameters and colors of the circles are related to their peak intensities in Figure 3.
Conclusions
Near-IR spectra - including matrix scans - from single-wall carbon nanotubes are easily recorded and analyzed using the NanoLog™ spectrofluorometer with the NanosizerTM software, respectively. The NanoLog™ is useful in a wide array of research related to nanostructures, quantum dots, and materials science for the future.

This information has been sourced, reviewed and adapted from materials provided by HORIBA.
For more information on this source, please visit HORIBA.