User demands for higher productivity without compromising the quality or precision of the results has resulted in a rapid increase in both EDS and EBSD detector output in recent years.
Oxford Instruments' AZtec large area mapping is capable of collecting data with great detail over large sample areas at the highest speeds. The capability of applying single field analysis tools to the large area data sets is demonstrated in this article.
Large Area Mapping
Analyzing over large sample areas offer a number of benefits which include:
- Complete analysis of large samples and large sample areas
- The capability to see nano-scale detail and micro-scale features in the same data set
- Collection of representative and statistically significant data sets
- The requirement for a minimum number of points or grains sampled
- For obtaining a representative analysis over coarser grained material
- Analysis over non-uniform microstructures or materials containing scattered phases
This article shows the capability of large area mapping using two data sets to visualize the change in microstructure over the complete sample.
Bent Nickel Tube – Example 1
The experiment involves studying a nickel sheet use in manufacturing gas pipelines. As part of the manufacturing process, the sheet material is bent, and it the effect of this process on the microstructure is crucial to understand.
In order to collect statistically significant data from the complete sample offering detailed overview of the microstructure, 90 fields were collected, automatically aligned and montaged.
Along with being easy to use, AZtec large area mapping works on both tilted and flat samples. It also has the ability to correct for samples that are not entirely flat, altering the Z across the sample to ensure that it stays in focus.
It was possible to view and interrogate the montaged data as though it were a single field. Figure 1 shows the grain boundary map created from a montage of 90 fields. The black boundaries are the high angle boundaries (>10°), red denotes the twin boundaries (13), and grey the low angle boundaries (>2°). The increase in density of the low angle boundaries are an indication of regions of deformation in the sheet.
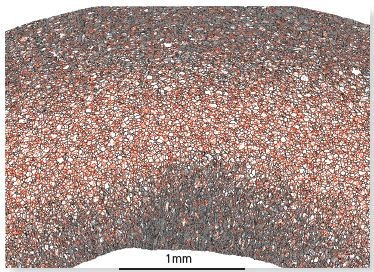
Figure 1. This grain boundary map is created from a montage of the 90 fields.
Figure 2 shows the local average misorientation map and Figure 3 shows the IPF map. Figure 4 shows the montaged data.
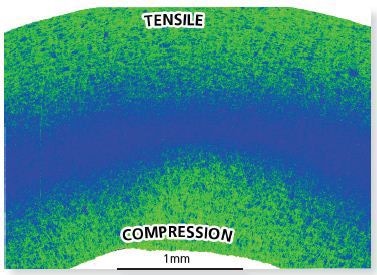
Figure 2. The Local Average Misorientation Map illustrates where there is a high level of misorientation within the sheet. The high misorientaion is an indication of areas of tensile and compressive strain as indicated.
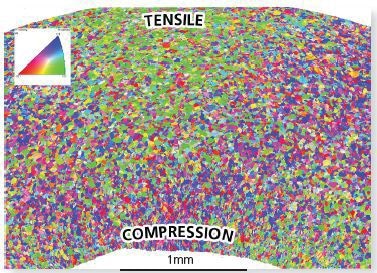
Figure 3. Processing the data to show the IPF map indicates a systematic variation in texture associated with the folding. The original fiber texture is reinforced in the tensile regions. There is a new texture generated in the compressed region.
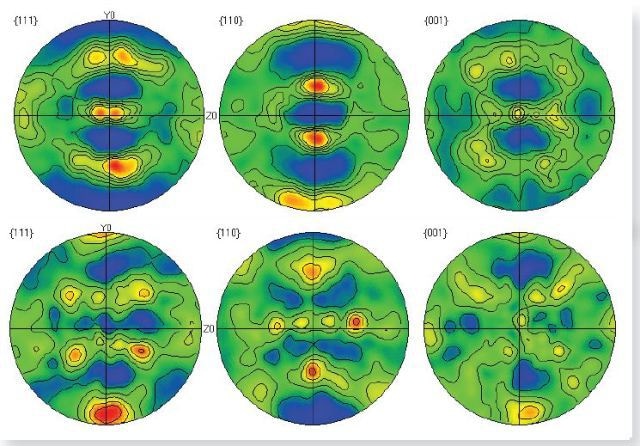
Figure 4. The montaged data can be subsetted and pole figures plotted from the different regions.Upper: Tensile - Partial {111} and {001} fibre texture. Lower: Compression-Partial {110} fibre texture generated.
Geological Sample – Example 2
A coarse grain peridotite mantle xenolith was investigated. It is important to apply large area mapping as the sample is highly coarse grained with grain size up to several mm. The need was to cover a statistically significant number of grains. EBSD & EDS data were simultaneously collected to investigate grain size, phase and element distribution.
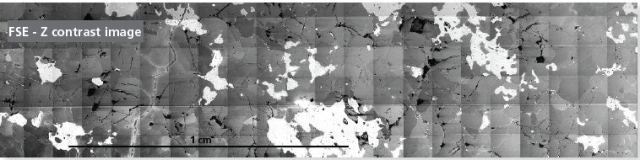
Figure 5. FSE-Z contrast image
The mapping of the sample surface was done and 138 fields were collected at a magnification of 200x. The FSE-Z contrast image shows this. The total sample width mapped was greater than 2cm.
The montage data set included the EDS and the EBSD maps and all of this data can be interrogated. The phases were identified using EBSD 4 and the same four phases were detected with the EDS autophase map.
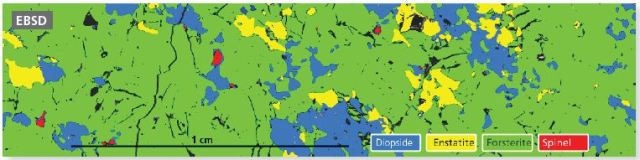
Figure 6. EDS AutoPhaseMap.
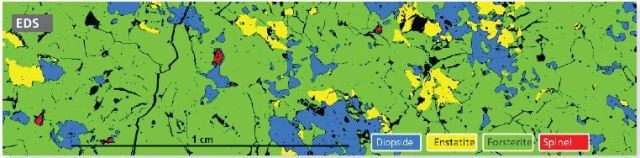
Figure 7. EBSD Phase map.
ConcIusions
The collection of data over larger sample surfaces is an increasing requirement. This is required to provide complete sample knowledge and to obtain statistically significant data. Furthermore, with the increase in detector speeds, it is possible to collect these large data sets in reasonable timeframes.
AZtec Large Area Mapping is a powerful tool in collecting simultaneous EBSD and EDS data from large sample surfaces. It offers the capability to study both micro- and nano-scale structure from a single data set. It helps collect high-resolution maps and images from large areas and to investigate areas of detail from a large sample.
Furthermore, once collected, the montage data set can be examined with all the tools which are available when studying a single field.

This information has been sourced, reviewed and adapted from materials provided by Oxford Instruments Nanoanalysis.
For more information on this source, please visit Oxford Instruments Nanoanalysis.