NTA provides information on particle size distribution of samples in liquid suspension using the properties of Brownian motion and light scattering. When particles in suspension are exposed to a laser beam traversing the sample chamber, they scatter the light, which makes them visible through a 20x magnification microscope. The camera mounted on this microscope captures the particles’ Brownian motion within its field of view (FOV) as a video file (Figure 1).
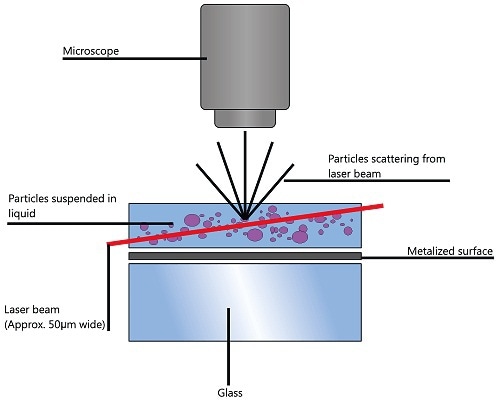
Figure 1. Schematic of the optical configuration used in NTA.
The center of the particles is identified by the proprietary NTA software to determine the average distance traveled by each particle in the x and y directions. From this value, the particle diffusion coefficient (Dt) can be calculated. When the solvent viscosity (η) and sample temperature (T) values are known, the sphere-equivalent hydrodynamic diameter (d) of the particles can be determined with the help of the Stokes-Einstein equation:
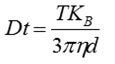
Where, KB is Boltzmann's constant.
NTA sizes each particle one at a time regardless of the others. Figure 2 illustrates the size distribution profile generated by NTA. Since the particles’ motion is tracked within a fixed FOV (roughly 100 µm by 80 µm) irradiated by a laser beam of roughly 10µm in depth, the sample’s scattering volume can be calculated. The particle concentration within this FOV is measured and extrapolated to a larger volume to estimate the concentration in particles per mL for an overall total or any given size class.
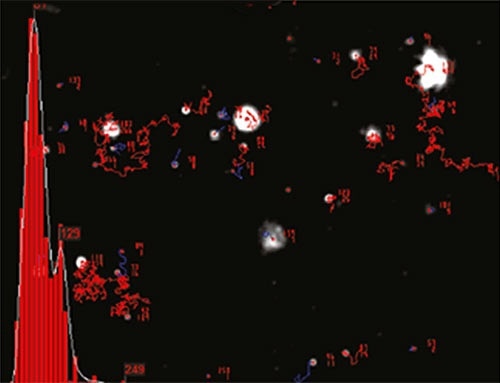
Figure 2. An example of the size distribution profile generated by NTA. The modal size for this sample is found to be approximately 70nm, with larger sized particles also present.
Characterizing Exosome and Microvesicle
The ability to measure sub-micron particles relies on the refractive index of the particle. The smallest detectable size for very high refractive index particles like colloidal gold is 15 nm diameter. Conversely, the smallest detectable size for lower refractive index particles such as exosomes is in the range of 30-40 nm. The upper size limits are typically 1-2 µm diameter and are reached when finding difficulty in accurately tracking a particle’s Brownian motion.
The laser irradiation of the nanoparticles causes fluorescence excitation. The resulting nanoparticles labeled with corresponding fluorescent molecules can be detected and sized, and their concentration can be quantified using appropriate optical filters. A number of organic fluorophores can be excited using a 532 nm green laser diode and individual semiconductor CdSe nanocrystals can be detected using a deep blue/violet 405 nm laser diode.
It is possible to achieve phenotyping within sophisticated mixtures using antibody-mediated fluorophore labeling of specific sub-populations of exosomes, thus allowing a specific exosome type to be speciated with Antibody(Ab)-labeling and simultaneous exosome size measurement through the analysis of its Brownian motion.
Comparison of NTA to Flow Cytometry and Electron Microscopy
As an absolute technique, NTA calculates the size of the nanoparticles by measuring their dynamic Brownian motion characteristics. It is not influenced by the amount of scattered light from the particle as well as by the density and mass of the particle of interest.
Conversely, flow cytometry calculates the size of the nanoparticles based on the amount of scattered light from the particles and requires pre-calibration with particles that have a refractive index comparable to the that of the particles to be analyzed in order to achieve accurate measurements. Moreover, the knowledge on the light scattering properties of the sample nanoparticles is also essential for any flow cytometry analysis.
The results of a study confirmed that the concentration of microvesicles is underestimated by flow cytometric (FC) methodology. In another study, synovial fluid (SF) derived MVs, plasma and SF samples of patients having juvenile idiopathic arthritis, rheumatoid arthritis (RA), and osteoarthritis (OA) were analyzed for particle size distribution measurement in SF samples using NTA, electron microscopy and flow cytometry 'differential detergent lysis' method. Although, the size distribution results of MVs in SF samples obtained from the different techniques were in good agreement with each other, NTA analysis and mass spectrometry (MS) concluded that protein aggregates were associated with most of events instead of cell- derived vesicles.
According to the 'iceberg' theory, FC is capable of detecting particles larger than 200-300nm. Most of the particles in SF are smaller than this range. Conversely, NTA is capable of detecting any particles. The NTA system’s fluorescence capability and specific labeling allow exploring individual populations.
In a study, cellular microvesicles and nanovesicles were characterized by a group of researchers using FC and fluorescence NTA (fNTA). The study results concluded the superior sensitivity of the NTA system over traditional flow cytometry in the analysis of microvesicles and nanovesicles.
Current Detection and Analysis Methodologies
Relative and absolute size distributions of microvesicles can be determined within minutes using DLS and NTA. Although Raman spectroscopy is capable of detecting the size, biochemical composition, and concentration of single microvesicles devoid of labeling, it takes time to provide accurate measurements.
Fluorescence Correlation Spectroscopy (FCS) and fNTA could provide the absolute size distribution and biochemical information with help of fluorescent antibody labeling. However, addressing the practical and optical problems makes these methods more complex. Of these methods, fNTA was the most ideal technique capable of detecting size, cellular origin, biochemical composition, and concentration of microvesicles rapidly. Additionally, the relevant characteristics of microvesicles can be determined directly in body fluids using fNTA.
In an assessment of NTA, researchers concluded that NTA could address the issues and drawbacks related to current single-parameter technologies, thanks to its ability to provide direct and real-time visualization and quantitative measurement of nanoparticles in fluidic samples. An another evaluation of NTA involving the investigation of the Rab27 associated exosome pathway also confirmed the effectiveness and speed of the NTA system in the monitoring of the disruption of exosome secretion.
Conclusion
NTA is increasingly becoming a routine analysis method of microparticles and exosomes in a myriad of studies, proving its ability to determine the physicochemical nature of the microvesicular structures of interest.

This information has been sourced, reviewed and adapted from materials provided by Malvern Panalytical.
For more information please visit Malvern Panalytical.