With the help of TruPhase, a special characteristic of AZtec software from Oxford Instruments, it is now possible to distinguish between similar crystal phases by collecting EBSD and Energy Dispersive X-ray Spectrometry (EDS) data. EDS data helps in providing clarity to the EBSD solution at each point. EBSD has a number of applications such as geology, metallurgy, and materials science.
This article demonstrates the method of differentiating phases with similar crystal structures using TruPhase, in two different examples - a metallurgical application and a geological application.
Geological Experimental
In this experiment, mylonitic metapelite (MSEF1) sample from the Cardeto Metamorphic Complex in Southern Italy is used for investigating microstructural information using EBSD. The sample contains biotite mica, muscovite, apatite, almandine, albite, and quartz. All these minerals have similar crystal structures and unit-cell dimensions in all but the c-direction as tabulated in Table 1.
Discriminating these two phases using EBSD analysis alone is complex even under optimum analytical conditions. Figure 1 shows a phase map collected using AZtec’s TruPhase (D) showing the successful differentiation of biotite and muscovite mica. These minerals, however, have different chemistry. Specifically, biotite mica has higher Fe concentration and lower Al concentration than muscovite.
Table 1. The crystal properties of biotite and muscovite mica are very similar and can be difficult to differentiate using traditional EBSD.
| |
Biotite |
Muscovite |
| Crystal structure |
Monoclinic |
Monoclinic |
| Space group |
C2/m |
C2/m |
| Unit cell parameters |
a[Å]= 5.343 |
a[Å]= 5.189 |
| b[Å]= 9.258 |
b[Å]= 8.995 |
| c[Å]= 10.227 |
c[Å]= 20.097 |
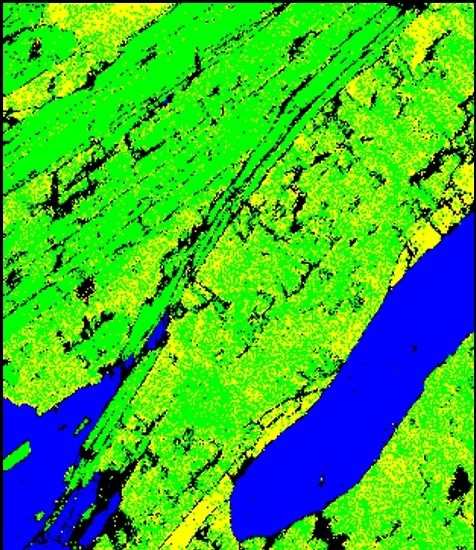
Figure 1. A phase map demonstrating that it is difficult to distinguish biotite and muscovite mica
Method
The sample is initially investigated following which a reference EDS spectrum was obtained for each mineral phase of the sample. Figure 2A and 2B shows the large area map (LAM) showing the distribution of the different mineral phases and a combined forescatter diode (FSD) image obtained for a small area of the sample, respectively.
AZtec TruPhase was then used to analyze the sample to acquire both an electron backscatter pattern (EBSP) and an EDS spectrum from the analyzed points. The obtained EDS spectrum is then loaded in Aztec to identify the possible EBSD solutions. This ensures successful differentiation between biotite and muscovite mica as shown in the Figure 2C.
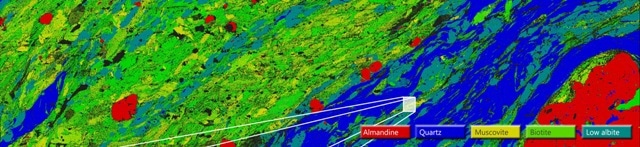
Figure 2A. A large area map (LAM) acquired from 83 fields at 150X magnification for sample MSEF1 showing the distribution of the different mineral phases
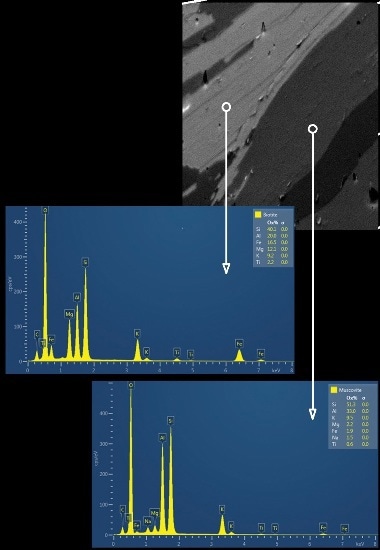
Figure 2B. A combined forescatter diode (FSD) image obtained for a small area of the sample and the reference EDS spectrum acquired for biotite and muscovite mica
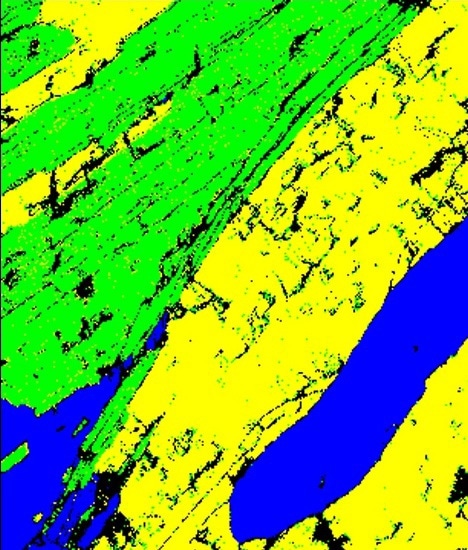
Figure 2C. A phase map showing the successful differentiation of biotite and muscovite mica.
Result
The results show the formation of different mineral phases in geological samples, indicating different metamorphic conditions. Further, resolving the complex crystallographic relationships between biotite mica and muscovite using EBSD helps providing insights into the deformation behavior of these minerals.
The EBSD analysis is used to obtain mica crystallographic preferred orientations (CPOs), determine the dominant slip systems and quantify crystal distortion.
Metallurgical Example
In this experiment, a hole made of a copper gasket is filled with solder. With the application of the heat, the solder is melt and a reaction occurs between the solder and the surrounding copper. The sample was analyzed using EBSD to identify the phase transitions.
The sample consists of elements such as tin, copper, lead and other combinations of tin and copper. The copper and tin were mixed during melting and heating of the solder. Lead and copper have similar crystal structures, unit cell dimensions and cubic phases as they belong to the same space group.
This ensures differentiation of the two phases based on the EBSD analysis. However, these phases have very different chemistries and thus can be distinguished using AZtec TruPhase.
Methods and Results
Initially, the sample was investigated and mapped using EBSD analysis. As shown in the Figure 3A, copper and lead are not successfully differentiated, and no copper appears in the sample.
The sample was then analyzed by collecting EDS maps to identify the copper distribution. Following the characterization, a reference EDS spectrum was obtained for each phase in the sample as shown in the Figure 3B.
Using AZtec TruPhase, the sample was then mapped. As shown in the Figure 3C, the lead and copper phases are successfully differentiated using this technique. This explains the simultaneous application of and EDS analyses in Aztec for the analyzing and resolving complex phase transformations.
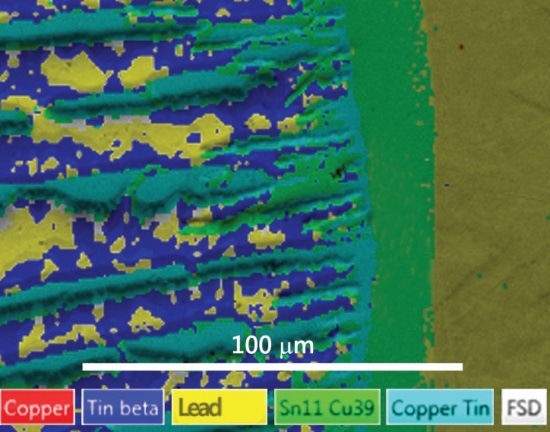
Figure 3A. A phase map collected using traditional EBSD which struggles to differentiate between the copper and lead present in the sample due to their similar crystal structures
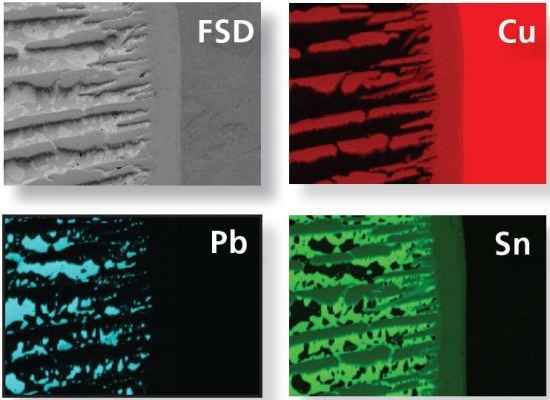
Figure 3B. FSD image and elements maps (Cu, Pb and Sn) acquired for the same area of the sample.
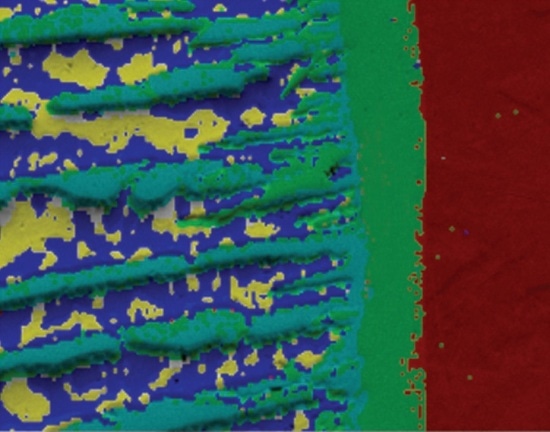
Figure 3C. A phase map collected using AZtec TruPhase showing the successful differentiation of the copper and lead within the sample
Conclusion
In this article, Oxford Instruments’ AZtec software is used to successfully demonstrate the discrimination between phases with similar crystal structures and different chemistry, with the help of two samples – geological and metallurgical samples.

This information has been sourced, reviewed and adapted from materials provided by Oxford Instruments Nanoanalysis.
For more information on this source, please visit Oxford Instruments Nanoanalysis.