Carboplatin, cisplatin and oxaliplatin are the most extensively used platinum-based cancer chemotherapy drugs in the Western world. Cisplatin is considered to be effective because of its ability to bind to the DNA, resulting in DNA-platinum (Pt) adducts, which bend the DNA. The cells are then expected to repair the DNA damage, otherwise DNA replication is blocked resulting in cell death1.
Many cancers are sensitive to platinum-based treatment in the beginning, but patients often relapse with tumors displaying resistance to further cisplatin therapy1. Cisplatin drug resistance is because of three major molecular mechanisms: increased DNA repair, altered cellular accumulation and increased cytosolic inactivation. Increased cellular export or decreased cellular uptake of cisplatin constitutes the mechanisms involved in altered cellular accumulation1.
Cellular uptake of cisplatin is related to tumor burden, meaning low intracellular cisplatin levels are associated with a decreased tumor response to cisplatin. There is a need to examine the uptake and distribution of cisplatin at the level of a single cell in order to determine whether treatment is effective. More cisplatin imported into cells results in increased DNA damage and more frequent cell death. Understanding the cellular uptake of cisplatin permits the development of new strategies and therapies to increase tumor sensitivity to cisplatin.
The problem with studying cisplatin uptake is the methodology, as represented in Figure 1. A population of cells has been traditionally treated with cisplatin, and the overall amount of platinum in the cell population is measured. The cells are digested, and a Pt concentration is attained by techniques such as inductively coupled plasma-mass spectrometry (ICP-MS) or atomic absorption spectroscopy (AAS). However, the importance of the concentration is unclear, leading to a number of questions:
- What does the concentration mean in terms of cells?
- Do some cells have high concentrations while others have little or no cisplatin?
- Do all cells have the same intracellular cisplatin concentration?
The disadvantage of this traditional approach is that the Pt concentration represents the total population of cells instead of individual cells. Therefore, the traditional methods do not represent the distribution and individual cellular variation of cisplatin uptake. In reality, cellular uptake of cisplatin most likely differs in response, but until now, there have not been efficient methods to evaluate its uptake.
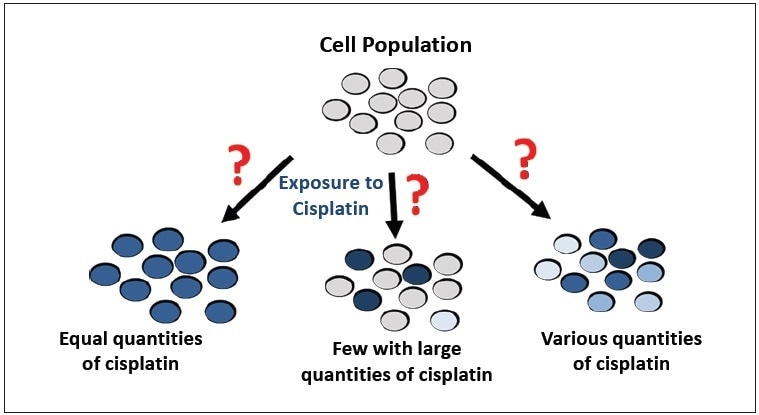
Figure 1. Possible results of cisplatin uptake by a population of cells.
A new, emerging technique has been developed that permits the quantitation of metal at the level of a single cell: Single Cell ICP-MS (SC-ICP-MS). SC-ICP-MS is based on the Single Particle ICP-MS (SP-ICP-MS) technique, which allows for the quantitation and evaluation of nanoparticles in solution. Both techniques are based on the potential to measure discrete signals produced from a single cell (or a nanoparticle) when they enter the plasma. The metal content in each cell is ionized, generating an ion plume that is measured with the enabled fast data acquisition of 100,000 data points per second, permitting the metal content within individual cells to be quantified down to attogram (ag) per cell levels. The resulting information yields increased information in comparison to traditional methods in order to measure cisplatin uptake in cells. This article describes how SC-ICP-MS is used to explore cellular uptake of cisplatin at the single cell level.
Experimental Cell Culture and Cisplatin Treatment
The ovarian cancer cell lines A2780 and A2780/CP70 were employed in all experiments. Cells were grown in RPMI 1641 media (Gibco™) supplemented with 10% fetal bovine serum (FBS, Gibco™), l-glutamine (Gibco™), insulin (Sigma-Aldrich™) and pen/strep (Gibco™) under 5% CO2 at 37 °C. Cells were plated and allowed to attach to the dishes for serum starvation experiments. The media was removed and replaced with serum-free media for approximately 18 hours, and then the media was replaced with regular media to commence cisplatin treatment. Cisplatin was re-suspended at 1 mg/mL in sterile saline and dynamically shaken for 30 minutes before the treatment. Figure 2 shows the schematic of the sample preparation. Cells were treated with 30 µM cisplatin for a time course where samples were collected at 1, 2, 4, and 8 hours after the treatment. For analysis, cells were washed twice with phosphate-buffered saline (PBS) and collected using the nonenzymatic cell dissociation solution Cellstripper (Corning™). Cells were centrifuged at 500 g-force for 10 minutes. The supernatant was discarded, and the cells were resuspended in 1 mL PBS, filtered via a 70 µm nylon mesh and quantitated by hemocytometer counting. Cells were diluted in PBS to a final concentration of 100,000 cells/mL and kept on ice until injection.
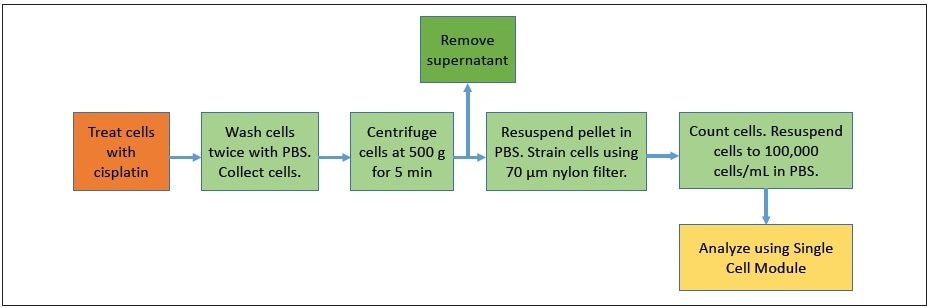
Figure 2. Schematic showing sample preparation steps.
Instrumentation
Analyzes were carried out with PerkinElmer’s NexION® ICP-MS using the Syngistix™ Single Cell Application Software Module for data collection and processing, as shown in Figure 3. Instrumental conditions are shown in Table 1, with the NexION being tuned daily for optimum sensitivity and performance. The Single Cell Sample Introduction Kit (Part No. N8150031) was used for sample introduction to the NexION. The kit comprises of a high-efficiency nebulizer (Part No. N8142046) and the proprietary, new Asperon™ spray chamber custom designed for optimal transport of cells to the plasma (Part No. N8152493). Since cells (1-100 µm) are bigger than droplets, which typically pass via conventional spray chambers (< 2 µm), a new spray chamber was designed for optimal performance.
Ionic platinum standards were developed in PBS to matrix match the cell sample. A standard curve was produced using 1, 2, and 3 ppb platinum standard. Transport efficiency was established using 60 µm gold nanoparticles in PBS.
Results and Discussion
The ovarian cancer cell lines A2780 and A2780/CP70 are the cells selected for this article. These cells are good models for developing the single cell method since the molecular mechanism for resistance is modified by cisplatin uptake. The A2780/CP70 line is cisplatin resistant and the A2780 is a cisplatin-sensitive cell line. This resistance was developed by exposing the A2780 parental cell line to increasing doses of cisplatin. The A2780/CP70 cells produced resistance by decreasing cisplatin uptake in addition to up-regulating DNA repair2.
Table 1. ICP-MS Conditions.
| Parameter |
Value |
| Sample Uptake Rate |
0.04 mL/min |
| Nebulizer |
MEINHARD® HEN |
| Spray Chamber |
Asperon |
| Injector |
2.0 mm id Quartz |
| RF Power |
1600 W |
| Neb Gas Flow |
0.36 L/min |
| Makeup Gas Flow |
0.7 L/min |
| Platinum Isotope |
195 amu |
| Dwell Time |
50 µs |
| Sample Analysis Time |
60 s |
Cisplatin uptake was explored by performing a time course experiment in order to analyze how the distribution of cisplatin uptake changed over time within the cellular population. Both cell lines were treated for 1, 2, 4, and 8 hours with 30 µM cisplatin. Two real-time plots were produced during sample analysis: one shows the intensity response vs. sample number, while the second takes this data and changes it to a histogram showing the frequency of response vs. mass-per-cell; both plots are shown in Figure 4. It is possible to integrate the mass distribution peak after collecting the data, as shown in the third plot in Figure 4.
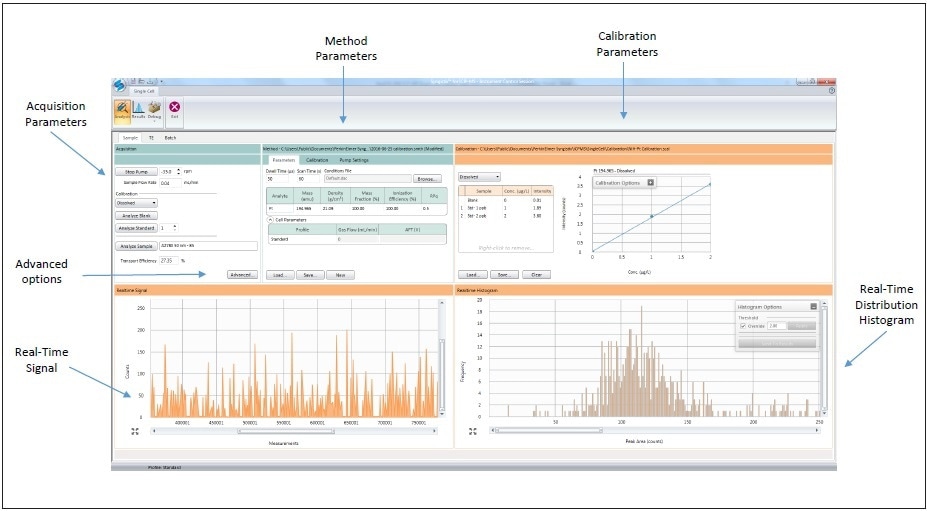
Figure 3. Syngistix Single Cell Application Software Module.
The cisplatin time course results are shown in Figure 5 for both cell lines. At one hour of cisplatin treatment, both cell lines show extremely little uptake of platinum. As time progresses, cells from both lines import increasing amounts of cisplatin and show a heterogeneous distribution. At eight hours after cisplatin treatment, the A2780 and A2780/CP70 cell lines have a subpopulation of cells with less cisplatin in comparison to the rest of the cellular population. Additionally, there is a major difference between the cell lines at eight hours as A2780 has an increased population of cells with more cisplatin than A2780/CP70. These results are concordant with what has been observed earlier in the literature – A2780 cells accumulate more platinum than its cisplatin-resistant cell line A2780/CP702.
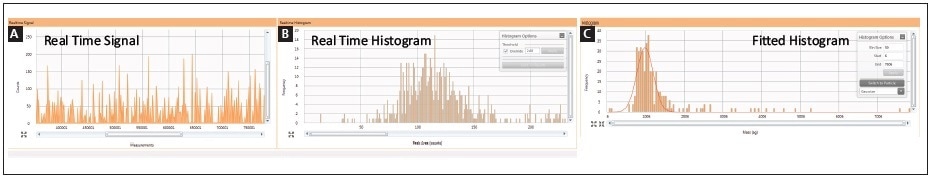
Figure 4. Real-time analysis of single cells exposed to cisplatin by SC-ICP-MS: (A) measurement vs. intensity; (B) peak area vs. frequency histogram; (C) integrated/fitted histogram.
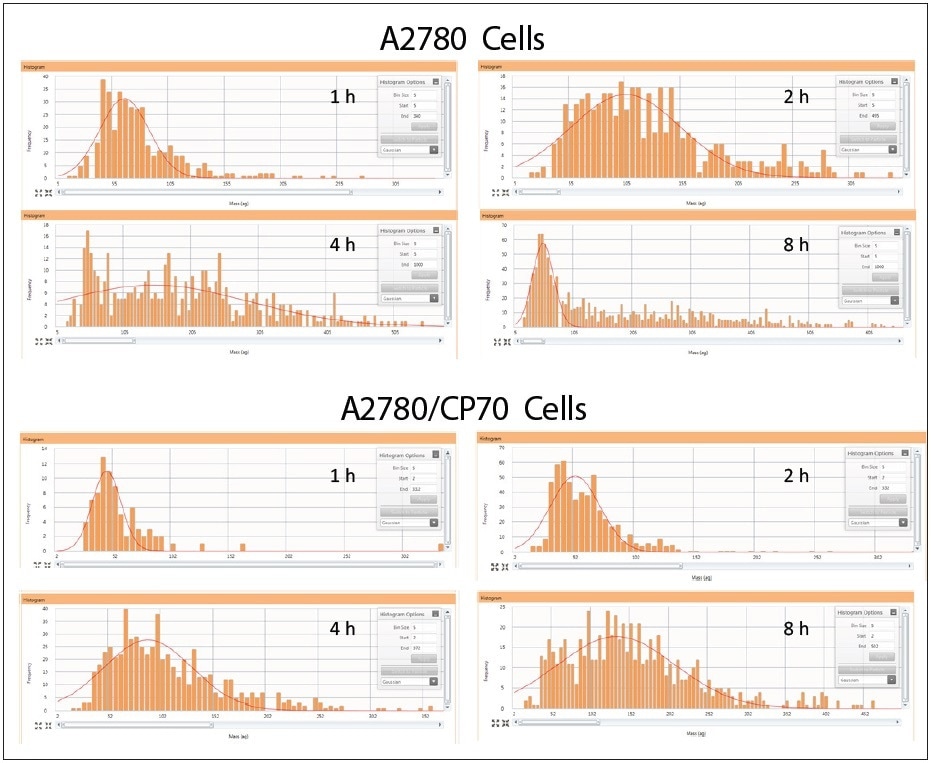
Figure 5. Cellular cisplatin uptake in A2780 and A2780/CP70 over time. Note: samples on different scales.
Fitting each histogram with a Log Normal curve helped summarize the time course data. The mean intensity was established for each time point and plotted to show the cisplatin uptake difference between A2780 and A2780/CP70 cells over time, as shown in Figure 6. Here, it is observed that cisplatin-sensitive A2780 cells have increased cisplatin uptake when compared to the cisplatin-resistant A2780/CP70 cells over time.
Cells were serum starved in order to determine whether the heterogeneous distribution of cisplatin uptake was due to differences in the cell cycle. When cells are grown in tissue culture, the culture is normally a mixture of asynchronous cells growing at varied rates, resulting in a wide range of cells at different stages of the cell cycle, as represented in Figure 7. The four parts of the cell cycle are referred to as G1, S, G2 and M. The G1 phase is the first (and normally longest) growth phase, followed by the S phase, where DNA is synthesized and replicated in preparation for cell division. Next, is the G2 growth phase, followed by the M (or mitosis) phase where cells divide into two cells. Thus, it is likely that the differences in cisplatin levels may be due to differences in the cell cycle phases. Starving the cells of serum allows the growth factors to be removed from the media and the cells will stall in the G1 phase.
The cisplatin uptake time experiments were repeated comparing the uptake difference between the control and serum-starved cells. The results of the serum starvation experiments where the mean intensity was determined for each time point and plotted are shown in Figure 8. These results highlight that serum starvation had no effect on the uptake of cisplatin in either the A2780 or the A2780/CP70 cell lines; both display similar cisplatin uptake rates as the control cells. Thus, these results imply that the heterogeneous distribution of cisplatin uptake in cells is not due to the cell cycle but rather some other unknown mechanism.
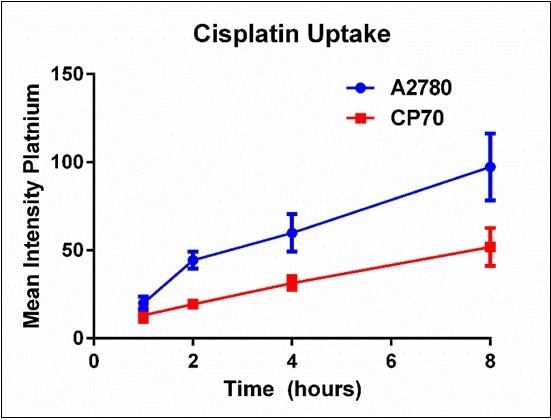
Figure 6. Summary of platinum mean intensity for each cell line over time. Results are a summary of n=3 independent experiments and plotted mean ± standard deviation.
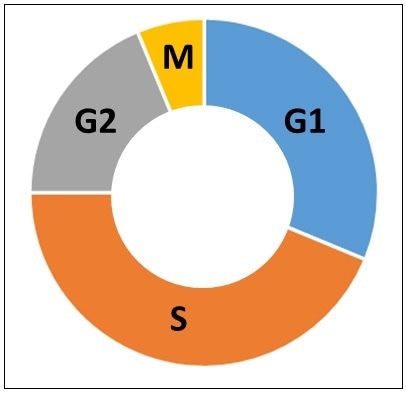
Figure 7. Phases of the cell cycle. G1 is the first growth phase. S is the synthesis phase. G2 is the second growth phase. M is the mitosis phase.
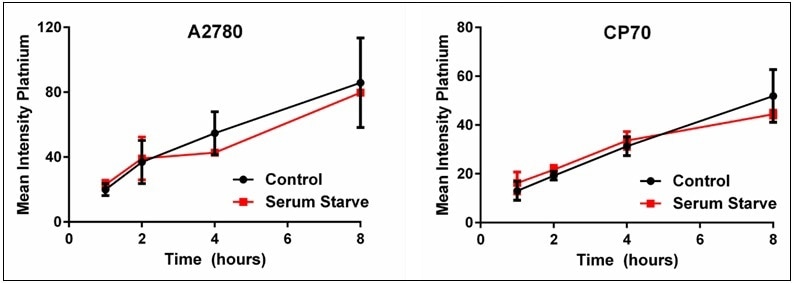
Figure 8. Plots of control vs. serum-starved cells for cisplatin uptake. These plots show that heterogeneous cellular cisplatin uptake is not due to cell cycle. Results are a summary of n=3 independent experiments and plotted mean ± standard deviation.
Conclusions
Single Cell ICP-MS is considered to be a robust method for measuring platinum at the level of a single cell. The ovarian cancer cell lines A2780 and A2780/CP70 were used to demonstrate that cisplatin uptake increases over time. The cisplatin uptake differs with the cisplatin resistant A2780/CP70 cell line, importing reduced levels in comparison to the A2780-sensitive cell line. The cellular difference in a population of cisplatin uptake was not due to variations in cell cycle, as serum-starving cells did not change the whole uptake of cisplatin. Intercellular variability of cisplatin uptake is due to other factors which are yet to be determined.
Single cell ICP-MS analysis enables the quantitation of cisplatin within individual cells and is a considered to be an improved method for analyzing cisplatin uptake within a population of cells. This article demonstrates the possibility of detecting internal cisplatin at the level of a single cell. The distribution of cisplatin uptake is heterogeneous in cells and varied from cell to cell, which perhaps more closely reflects what takes place within tumors.
Future studies using Single Cell ICP-MS will help in developing new strategies in order to increase cisplatin uptake in cells and novel pathways that influence cellular cisplatin import and export.
Consumables Used
| Component |
Description |
Part Number |
| Sample Uptake Tubing |
Orange/red (0.38 mm id), PVC, flared, pack of 12 |
N0773111 |
| Spray Chamber Drain Tubing |
Grey/grey (1.30 mm id), Santoprene, pack of 12 |
N0777444 |
| Platinum (Pt) Stock Standard |
1000 ppm Pt, 125 mL |
N9303791 |
| 60 nm Gold (Au) Nanoparticles |
2.60E+10 particles/mL, 25 mL |
N8142303 |
| Sample Tubes |
15 mL, case of 500
50 mL, case of 500 |
B0193233
B0193234 |
References
- Amable L. (2016) Cisplatin resistance and opportunities for precision medicine. Pharmacol Res. 106:27-36.
- Parker R.J. Eastman A. Bostick-Bruton F. Reed E. (1991) Acquired cisplatin resistance in human ovarian cancer cells is associated with enhanced repair of cisplatin-DNA lesions and reduced drug accumulation. J Clin Invest. 87(3):772-7.

This information has been sourced, reviewed and adapted from materials provided by PerkinElmer Inc.
For more information on this source, please visit PerkinElmer Inc.