Due to a strong overlap between the N 1s core line and the Ga LMM Auger series, GaN is one of many materials that present problems when analysis is attempted with the traditional Al Kα excited X-ray photoelectron spectroscopy (XPS).
This naturally causes problems with accurate quantification, as well as chemical state assignments. This article outlines how GaN was analyzed using various X-ray excitation sources to shift the binding energy position of the Ga LMM Auger series preventing its interference with the N 1s region.
An added benefit in using the Kratos AXIS Supra+ is the automation of changing between the Al Kα and Ag Lα excitation sources.
Introduction
A vital prerequisite for the research and development of high-performance nitride light-emitting and electronic devices is the preparation of high-quality GaN bulk and thin-film single-crystal materials1.
An important tool for surface analysis is X-ray Photoelectron Spectroscopy (XPS), an analysis technique that is commonly used in the analysis of thin-film materials. This is done to obtain accurate stoichiometric information as well as chemical state assignment of the elements present.
One problem not uncommon with the standard monochromatic Al Kα X-ray source is the problem of overlap of Auger peaks with core-level photoemission peaks. This can pose difficulties for accurate quantification, as well as the process of assigning chemical states.
This occurs with GaN materials, in which the Ga LMM Auger series overlaps with the N 1s region; this issue affects quantification as well as the chemical analysis of nitrogen.
In this article, GaN is characterized by XPS using 3 different X-ray sources, monochromatic Al Kα, monochromatic Ag Lα, and achromatic Mg Kα, in order to stop this problem from occurring.
Experimental
GaN was analyzed using a state-of-the-art Kratos AXIS Supra+ spectrometer (fitted with a monochromatic Ag/Al and achromatic Mg X-ray sources). High resolution region spectra were acquired over a small energy range, whilst survey spectra were acquired over a large energy range.
For laboratory-based instruments standard X-ray sources are Al Kα or Mg Kα provide photons with an energy of 1486.6 eV and 1254.6 eV respectively. The Ag Lα excitation source has photon energy roughly twice that of Al Kα, of 2984.2 eV. Therefore, the Ag Lα monochromatic source uses second-order diffraction of the same quartz crystals used for the Al monochromatic source.
Seamless switching between the Al Kα and Ag Lα excitation source is achieved by automation of the X-ray source and monochromator mirror through the ESCApe software.
For some elements the greater photon energy of the Ag Lα X-ray source allows excitation of additional, higher binding energy core lines (as depicted in Figure 1). In addition, it is possible to analyze deeper into a material thanks to the decrease in attenuation length with increasing photoelectron energy2.
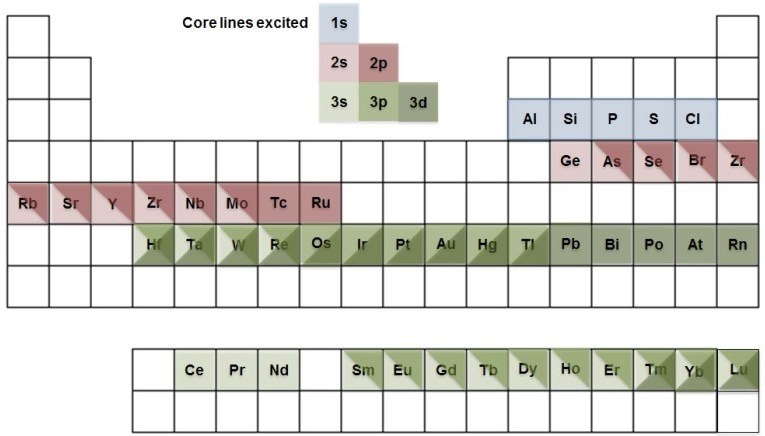
Figure 1. Additional, higher energy core lines accessible with Ag Lα excitation source.
Results and Discussion
Survey spectra were acquired from GaN using the 3 different excitation sources. As depicted from Figure 2’s blue spectrum, the Ag Lα excitation source can excite additional core lines up to binding energy of 2984 eV.
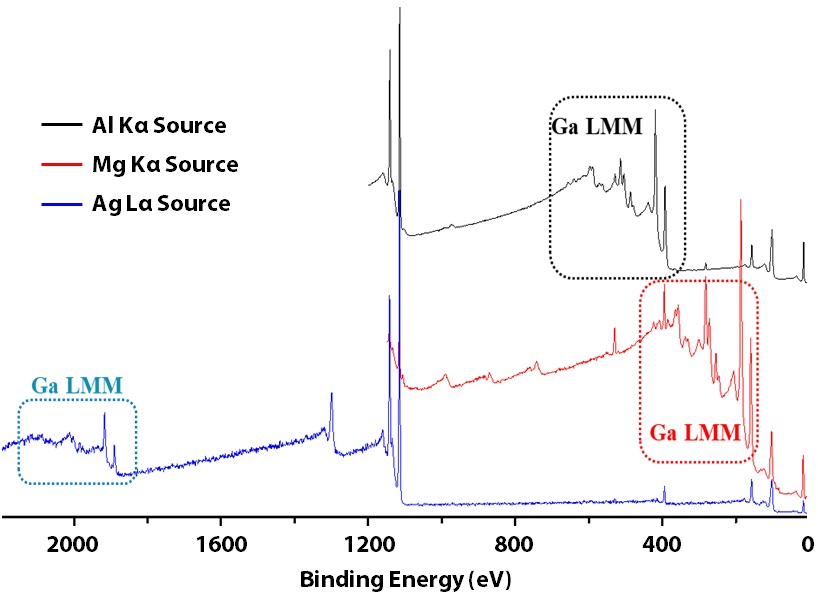
Figure 2. Survey spectra of GaN using monochromatic Al Kα (black)/Ag Lα (blue) and achromatic Mg Kα (red).
Emission of the Auger electron can occur following an internal rearrangement of an outer shell electron to fill the core vacancy created by the primary photoemission process. In some cases, Auger peaks of one element overlap with the characteristic photoelectron lines of other elements.
This results in complication during data analysis. The selection of a suitable X-ray excitation source can be vital in the separation of Auger and core-level photoemission peaks, as the kinetic energy of Auger electrons is irrespective of the photon energy.
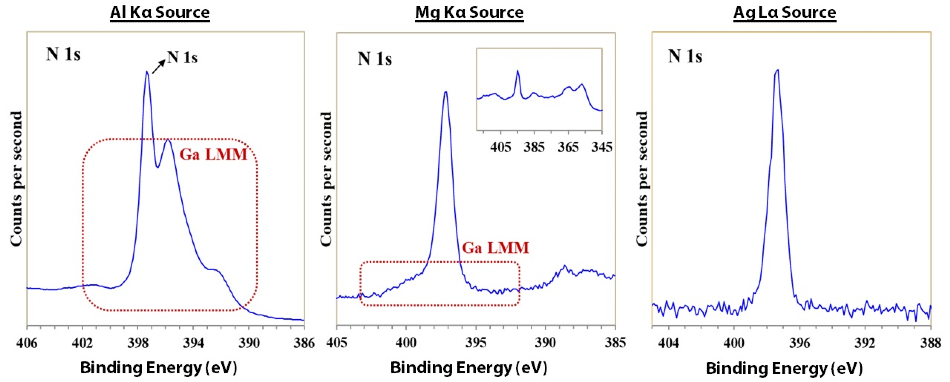
Figure 3. N 1s spectra acquired with a) monochromatic Al Kα, b) achromatic Mg Kα, and c) monochromatic Ag Lα X-ray sources.
Figure 3 reveals the N 1s region spectra for each excitation source. The Ga LMM Auger series overlaps strongly with the N 1s photoelectron line, as is depicted in Figure 2a and 2b. Accurate quantification and chemical state analysis of the nitrogen present in this sample is therefore, difficult and complex.
Using Ag Lα excitation source shifts the Ga LMM Auger series to higher binding energy eliminating its interference with the N 1s peak. Now, chemical state analysis of the N 1s peak can be obtained, as well as with accurate quantification using the Cant Relative Sensitivity Factors (RSF)3, as shown by Table 1.
Table 1. Quantification of GaN using monochromatic Ag Lα excitation source and Can’t Relative Sensitivity Factors3.
| Element |
peak |
BE (eV) |
RSF |
Atomic Conc. % |
| C |
1s |
285.0 |
1.00 |
14.25 |
| O |
1s |
532.7 |
2.93 |
11.37 |
| N |
1s |
397.7 |
1.81 |
36.26 |
| Ga |
2p3/2 |
1117.9 |
17.89 |
38.12 |
Conclusions
The Ga LMM Auger series is separated from the N 1s region by using the high-energy Ag Lα excitation source. This, therefore, permits accurate sample quantification to be achieved as well as the chemical state analysis of nitrogen to be determined.
Indeed, this concept can be achieved with other materials that experience similar overlapping regions. A significant added benefit is automated switching between the Al Kα and Ag Lα excitation sources on the AXIS Supra+.
References and Further Reading
- T. L. Duan, et al., Nanoscale Res. Lett., 2017, 12, 499-504.
- M. P. Seah et al., Surf. Interface Anal., 1979, 1, 2.
- A. G. Shard et al., Surf. Interface Anal., 2019, 51, 763-773.

This information has been sourced, reviewed and adapted from materials provided by Kratos Analytical, Ltd.
For more information on this source, please visit Kratos Analytical, Ltd.