Nanoparticles find their use in numerous everyday commercial products, including cosmetics, foods and pharmaceuticals. Their characterization at the nanometer scale requires very particular capabilities. For this specific application, a team of researchers at the LNE Nanotech Institute (France) synthesized measurements from multiple instrument techniques, including Scanning Electron Microscopy (SEM) equipped with a next-generation energy dispersive X-ray detector (EDX) and Atomic Force Microscopy (AFM).
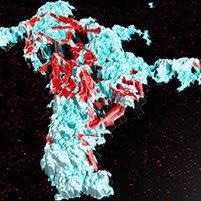
Image Credit: Digital Surf
Advanced processing software was necessary in order to correlate the data acquired and extract the information deemed relevant. For this task, MountainsLab®, developed by Digital Surf, is suitable.
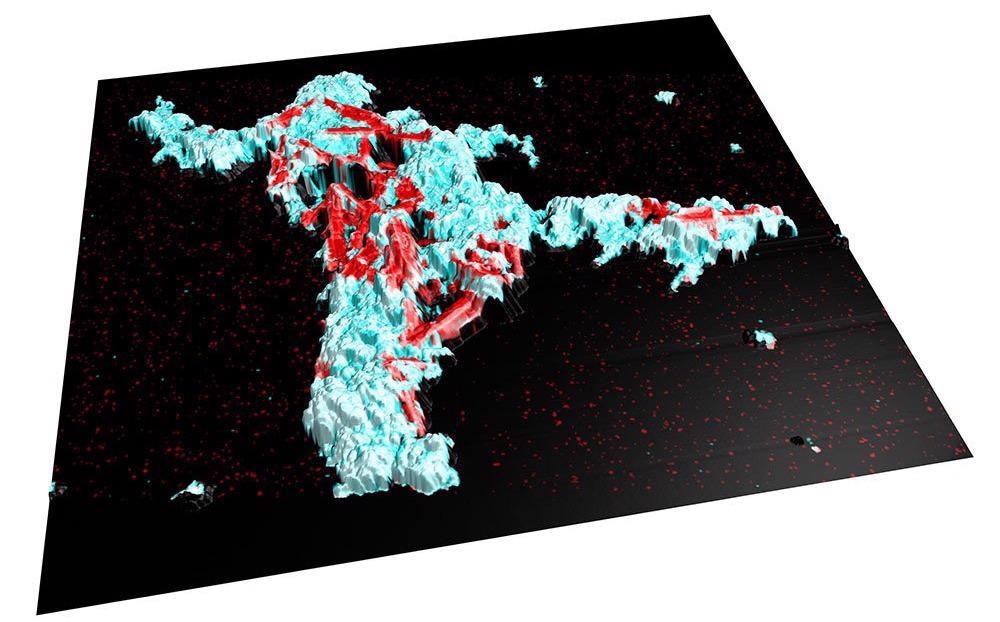
3D view of colocalized data (AFM topography + SEM image + EDX data). Image Credit: Digital Surf
Characterizing Nanoparticles in Mixtures
Typically, the measurement of nanoparticles contained in mixtures can be a major challenge. Indeed, many products incorporate several populations of nanoparticles to meet particular needs. For instance, to give a product an orange tint, the coloring agents TiO2 (white pigment) and Fe2O3 (red pigment) are amalgamated.
However, regulatory authorities demand that manufacturers and suppliers clearly state the size and size distribution of each nanoparticle population. This presents a significant problem in the case of mixtures. Taking measurements via the interconnection of AFM/SEM/EDX is thus a solution to this problem.
AFM and SEM data generate structural information on the particles. AFM produces exceptionally precise information along the vertical axis, whereas the SEM provides superb high quality resolution in the plane. EDX is then utilized as a supporting tool to ensure appropriate chemical classification and identification of each particle on the microscopy images.
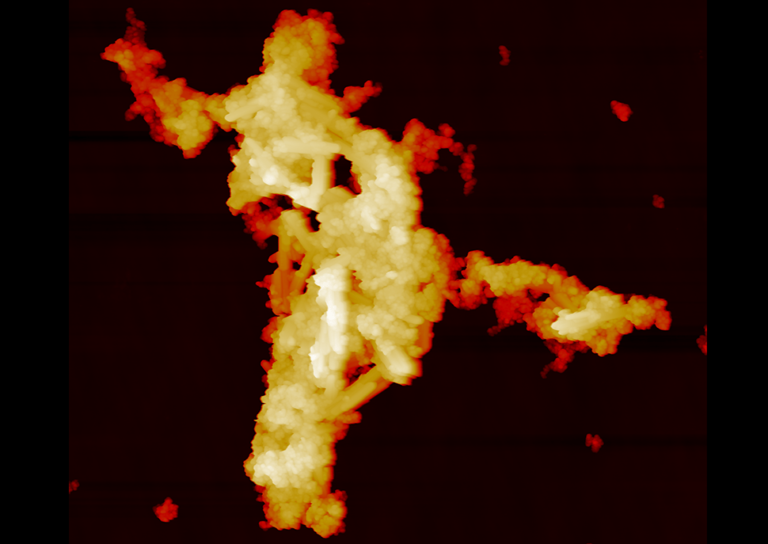
AFM topography of a nanoparticle mixture. Image Credit: Digital Surf
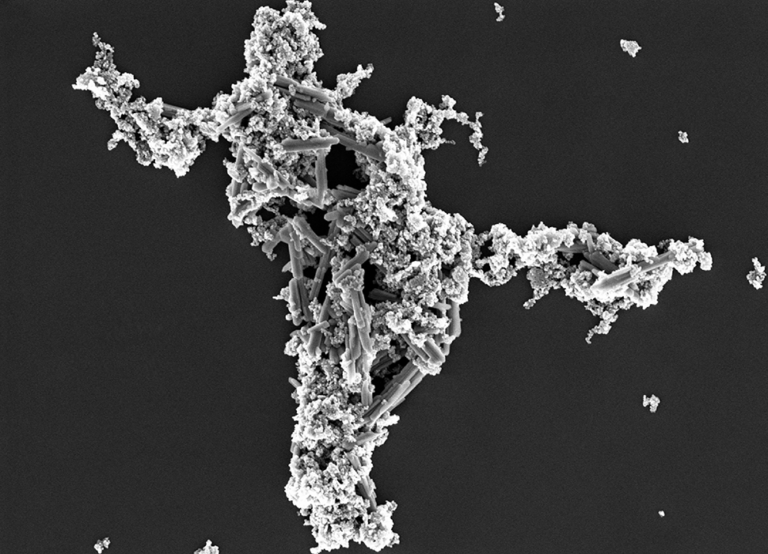
SEM image of the same surface. Image Credit: Digital Surf
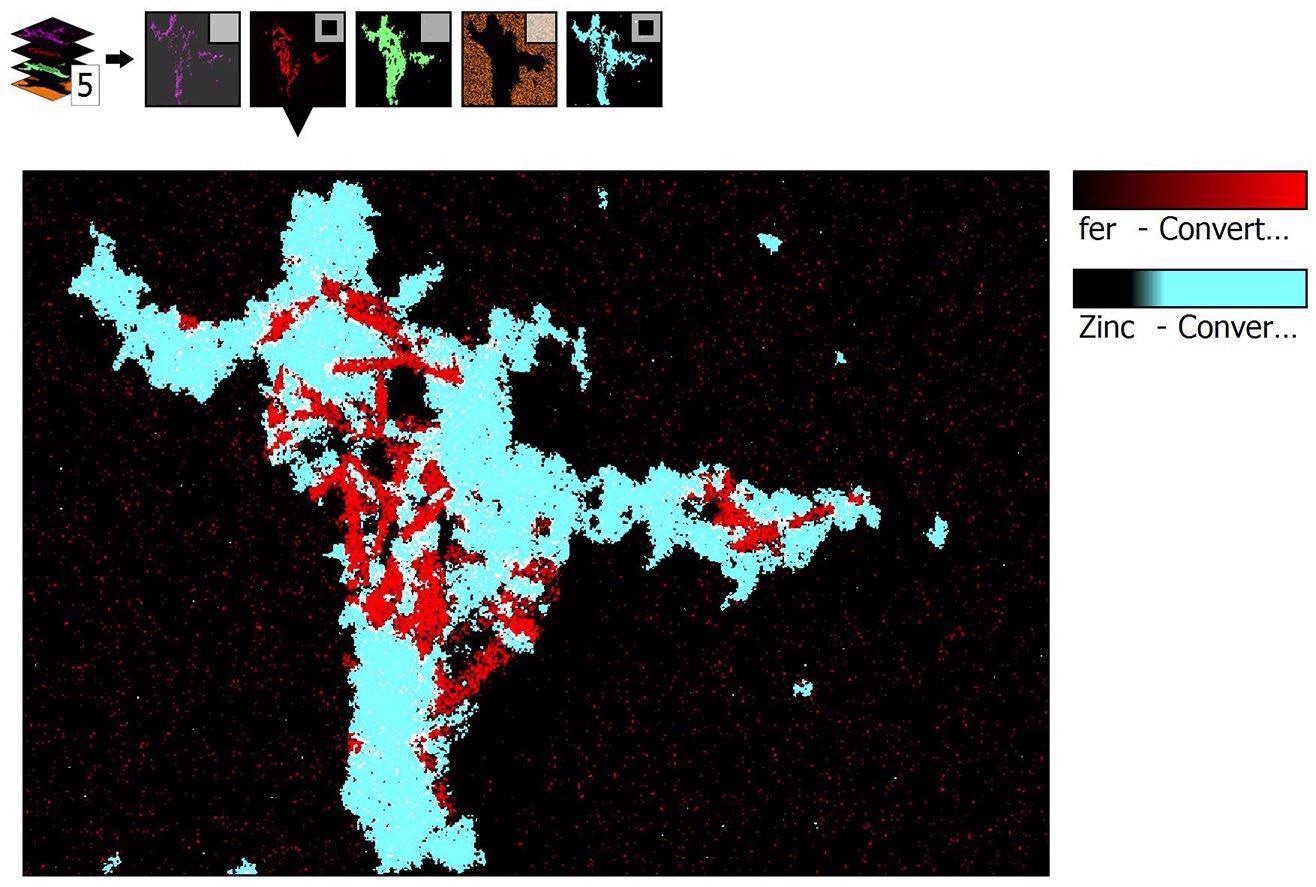
EDX data. Areas high in zinc are shown in blue; areas high in iron are displayed in red. Image Credit: Digital Surf
Determining Size Distribution by Correlation
During a recent study on a mixture of ZnO & Fe2O3, it was established that the size distribution of each population is attainable when utilizing this combining technique. There are three critical steps that are necessary to achieve the result:
- The sample is prepared correctly to prevent any agglomeration.
- Localization of the region of interest on the substrate is performed to image the same particles with various instruments.
- Correlation of the image data acquired is carried out.
As each of the methodologies generates images associated with varying information and reflecting its own constraints (dilatation, calibration, etc.), correlation can be tough to implement without post-processing. MountainsLab® software provides a wide variety of tools to enable the processing of the various datasets.
Initially, each image was independently processed. For instance, the AFM image was leveled. Then, by virtue of the “Colocalization” tool, the AFM and SEM images were merged together to acquire an image of the topography of the sample with high resolution in three dimensions. The ensuing “image” is then subsequently blended with EDX mapping (Fe and Zn).
Due to the fact that the correlative image provides information in 3D, it is possible to acquire an approximation of the volume, size and size distribution of each nanoparticle population imaged.
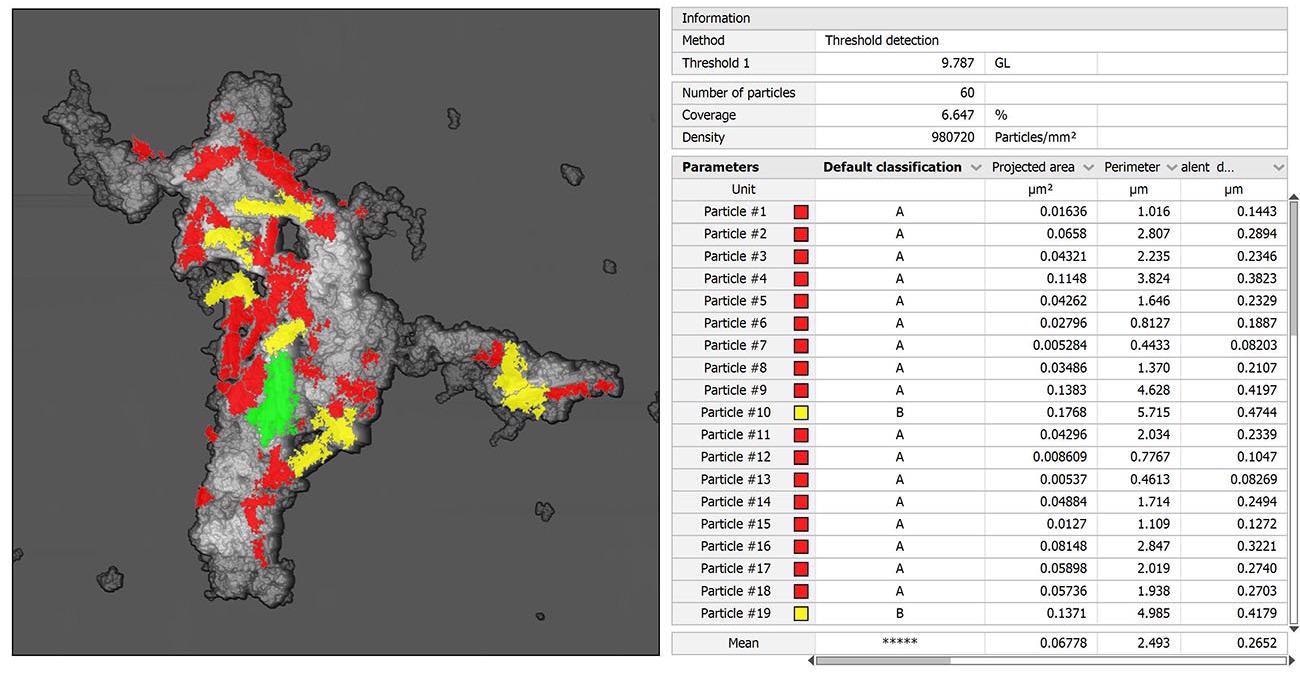
Particle analysis performed on correlated data showing areas, volumes etc. Image Credit: Digital Surf
Instruments and Software Used
Scanning Electron Microscope, Atomic Force Microscope, Energy Dispersive X ray spectroscopy and MountainsLab® software.

This information has been sourced, reviewed and adapted from materials provided by Digital Surf.
For more information on this source, please visit Digital Surf.