Newly developed high-entropy alloys (HEA), which are useful for high-temperature applications, show superior mechanical properties at elevated temperatures when compared to conventional superalloys or structural ceramics [1]. High-entropy is a term associated with the stable solid-solution formation phase resulting from high configurational entropy [2]. However, in some HEA compositions, the presence of multi-phase microstructures indicates that factors such as mixing enthalpy and therefore solubility of elements may also be predominant when controlling segregations during solidification, thus promoting multi-phase structures. The diffusion rate of each element in multi-phase systems influences their mechanical properties at elevated temperatures due to the equimolar presence of various elements in the alloying system.
Variations and diffusion effects of HEAs’ mechanical properties can be probed at the nanoscale using high-temperature nanoindentation technology. Local mechanical property changes from room temperature (25 °C) up to 500 °C can be monitored in the express test (ET) using the Nano Indenter® G200. Fast indentation integrated with a high-temperature laser heater system delivers accurate, local measurements of mechanical variations in the microstructures.
By controlling the indentation depth or load, large indentation arrays can be created to map Young’s modulus and hardness within target areas to produce high-resolution variation maps of different microstructural features such as grain boundaries, orientations, and different phases. This article illustrates the mechanical properties of a single-phase CoCrFeNi and dual-phase AlCrFeNiTi with face-centered cubic (FCC) and based centered cubic (BCC) structures at room and elevated temperatures.
Test Methodology
CoCrFeNi and AlCrFeNiTi HEA alloy samples were cut and their surfaces were processed for high-temperature nanoindentation tests. Both alloys with nominal compositions were cast at the University of Science and Technology Beijing (USTB) in China using magnetic levitation equipment and then cut to 10 mm x 10 mm pieces with a 3 mm thickness. The surfaces of the samples were ground and polished to roughly 50 nm to obtain a shiny, scratch-free surface. For nanoindentation tests, the processed samples were then mounted on a laser heater sample tray. To assure the maximum thermal stability, the sapphire laser heater tip, capable of being independently heated to testing temperatures similar to the samples, was installed on XP indenter head. The integrated thermocouples with temperature controller software were used to monitor both the tip and sample temperatures during the test.
The Nano Indenter® G200's laser heater system and a schematic of the high-temperature nanoindentation set up are shown in Figure 1. The ET mapping option was used to perform the nanomechanical measurements. In this study, the near-surface mechanical properties, as well as their variation and distribution at different test temperatures, were also statistically measured using ET. For each temperature, 100 indents were performed with a 100 x 100 µm array. The load or displacement control options in ET were used to control the indentation depth. The high-resolution mechanical property maps were produced in 200 µm x 200 µm areas on both samples with indentation spacing as small as 2.5 µm.
In this configuration, 6400 indents were performed. In addition to the distribution of mechanical properties within the grains, different phases or features such as grain boundaries were mapped. Site-specific nanoindentations were also conducted on AlCrFeNiTi multi-phase alloys using a standard, basic method to extract and compare the mechanical properties of individual phases to the statistical findings. For both HEA alloys, test temperatures were set at room temperature (RT), 100 °C, 200 °C, 300 °C, 400 °C, and 500 °C. During the test, argon was purged to avoid any contamination and oxidation at high temperatures. More details on the setup can be found in other KLA articles referenced in notes [3-6].
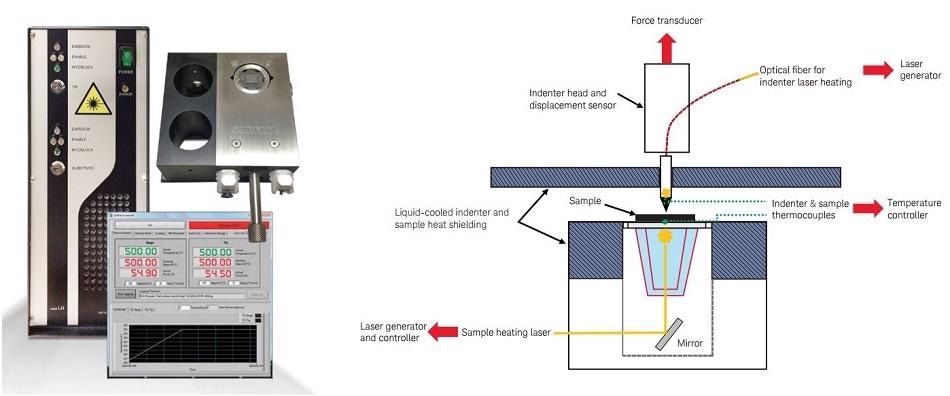
Figure 1. Keysight’s G200 laser heater system (left) and a schematic of the high-temperature nanoindentation set up (right).
Measurement Results
High-Temperature Statistical Nanoindentation on Single-Phase Alloy
The high-speed indentation was performed on the single-phase CoCrFeNi alloy using load-control ET method with a predefined load of 15 mN. The modulus and hardness results of the alloy at a temperature range of 25-500 °C are shown in Figure 2. There is a variation in the modulus and hardness of material from point to point, indicating the differences in the grain orientation or grain boundaries of the microstructure. These variations became more pronounced with increasing temperature, especially around 400 °C for Young’s modulus of the material, reflecting the elastic properties related to the crystal/phase structures, and orientation dependence. This variation shows some predominant textures growing at certain temperatures or changes in compositional homogeneity in the microstructure which caused such variations. Less variation appeared in hardness values, though abnormal behavior was noticed at around 400 °C.
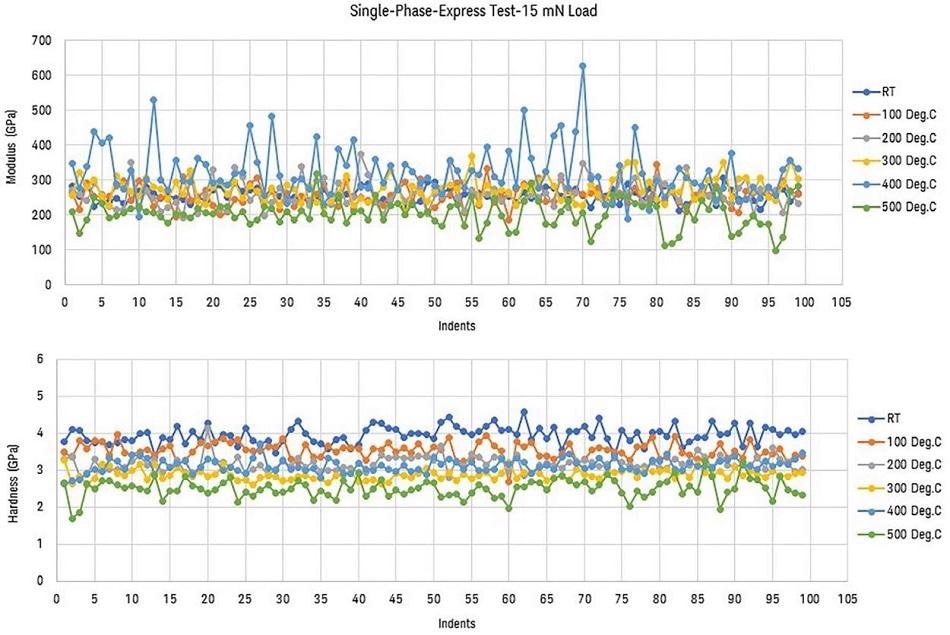
Figure 2. Modulus and hardness of a CoCrFeNi single-phase HEA alloy at different temperatures using the ET method.
Figure 3 lists the average quantified values obtained from ET measurements provided in Figure 2 along with their standard deviations. The indentation depth varied from ~400 nm to 500 nm at different test temperatures for the same applied load. In the article titled, “Using High-Temperature Nanoindentation to Study Mechanical Properties of High-Entropy Alloys,” CSM data on the same material was provided [6]. The results predicted in this ET study have higher values due to the small indentation load applied in this test that resulted in a smaller, more orientation sensitive or phase sensitive indentation depth.
It is to be noted that these values are also influenced by the size effect at such small indentation depths, which are more significant for higher temperature indentations, as shown in the CSM article [6]. When the indenter goes deeper into the bulk of the material, the deformation volume of material becomes more reflective of the whole bulk instead of the local properties as all effects are evened out and the properties become constant. Hence, ET is a robust method to measure the properties of individual features or phases of the microstructures and a very useful method for composite materials. However, care must be exercised to choose the indentation depths beyond the tip edge radius.
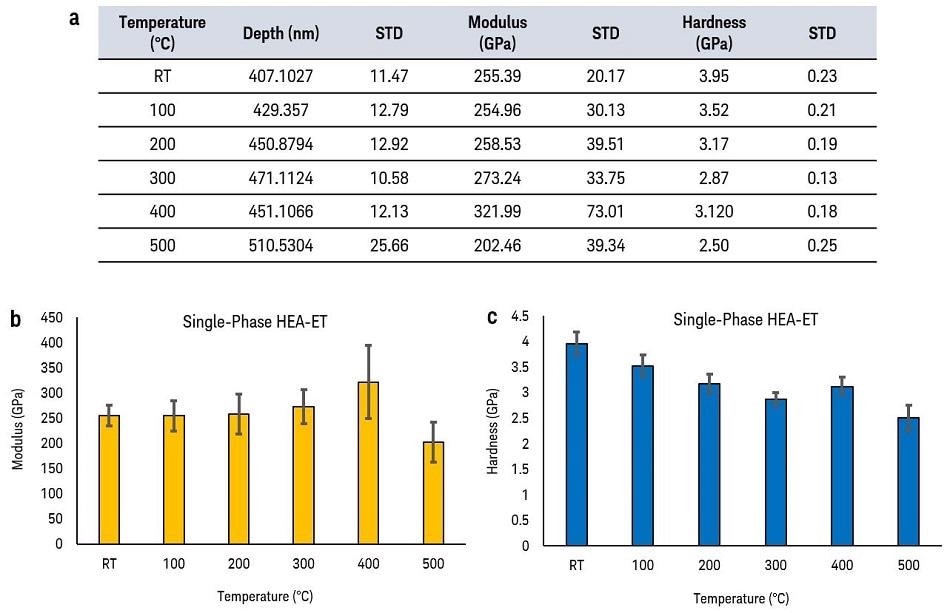
Figure 3. Quantitative modulus and hardness values of a CoCrFeNi single-phase HEA alloy at different temperatures using the ET method.
High-Temperature Statistical Nanoindentation on Multi-Phase Alloy
The AlCrFeNiTi alloy has multi-phase BCC structures. Its microstructure consists of as-cast large dendrites (grains) containing an abundant number of spherical phases that are uniformly distributed with an average size of 1 µm, surrounded by the eutectic phase. The eutectic phase also has needle-like morphology precipitates with a width range of 1-5 µm. The optical image of an AlCrFeNiTi microstructure and the aforementioned phases are shown in Figure 4. According to a study conducted at USTB using scanning electron microscopy equipped with energy dispersive X-ray spectroscopy (SEM-EDX), the matrix of the dendritic structure (A) is rich in Cr and Fe, but the surrounding eutectic phase (B) is rich in Al, Ni and Ti [7].
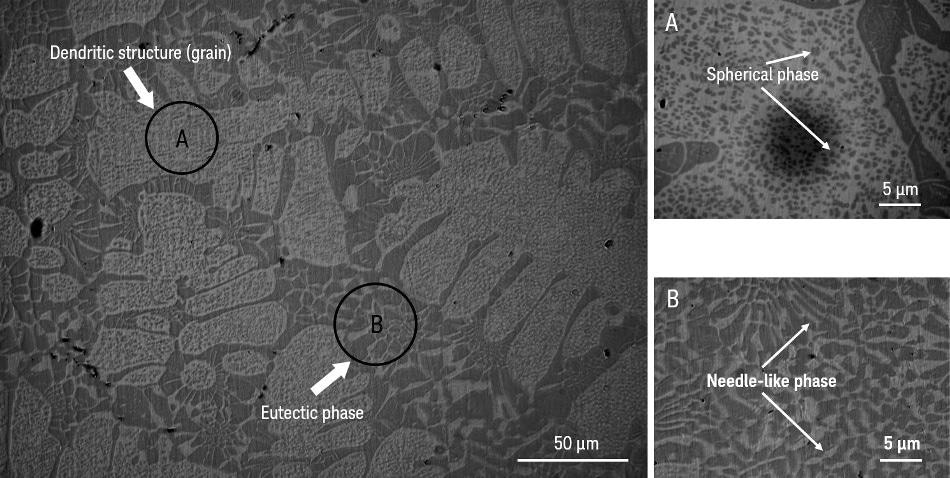
Figure 4. Optical images of an AlCrFeNiTi multi-phase alloy with an endritic structure (A) surrounded by an eutectic phase (B). Right insets show the spherical small precipitates distributed in the dendrites and needle-like precipitates in the eutectic phase.
Transmission electron microscopy (TEM) studies revealed that spherical small phases contain ordered BCC structures, whereas needle-like precipitates in the eutectic phase have the same main elements (Al and Ni) but with disordered BCC structures [7].
Basic, standard indentation tests were conducted selectively on individual phases with a small indentation depth (300 nm) to determine the properties of each phase. A basic test was conducted on the needle-like phase, in the matrix of grains containing no spherical precipitates and in the matrix of eutectic containing no needle-like phase. According to these measurements, the modulus and hardness of the grain matrix are 255 GPa and 7.5 GPa, respectively. For the needle-like phase, the values are 209 GPa and 8.30 GPa, respectively, and for the eutectic matrix, they are 213 GPa and 7.66 GPa, respectively. Spherical phases are too small for selective nanoindentation tests.
To extract the properties of this phase, ET was conducted inside the grains within the areas containing only dendritic structures. The hardness and modulus variations after data analysis are shown in Figure 5. In this ET test, the load was selected to achieve an indentation depth in the range of 250-300 nm, which is comparable to the basic test. As expected, the histograms clearly do not reflect the unimodal or normal distributions. Distributions are somewhat skewed, not centered around the mean of the values. The Young’s modulus histogram consists of two main peaks that are far away from each other: one around 237 GPa and the other around 251 GPa.
Basic tests of the grain’s matrix showed the modulus around 255 GPa which perfectly matches one of these peaks. It is assumed that the other one corresponds to the other phase, which are spherical precipitates. From the hardness histogram, it is difficult to distinguish clear peaks separated from each other. Since the hardness responds to the deformation volume underneath the indenter and in the composite structures, especially those with small, hard precipitates in the soft matrix, it is not possible to directly relate the response of deformation volume to the individual phases’ behavior. However, the hardness histogram shows two major distinguishable values: one around 7.7 GPa and the other around 8.3 GPa, which may correspond to the matrix and precipitates, respectively.
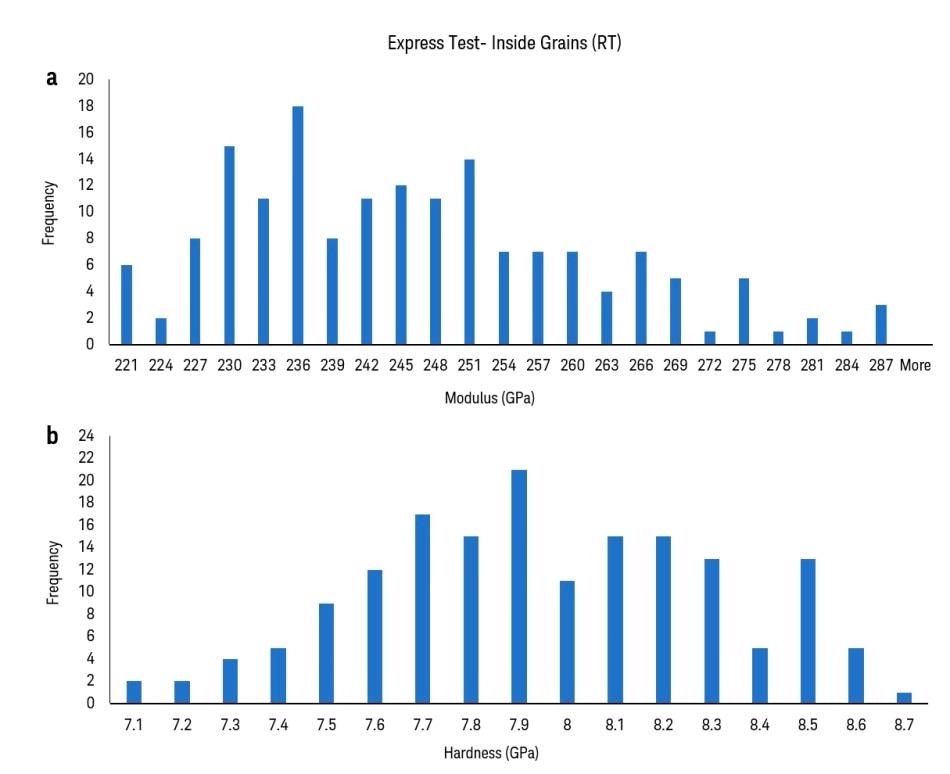
Figure 5. Histograms of modulus and hardness variation of an AlCrFeNiTi multi-phase alloy in the grains measured using the ET method.
Some of the results from a high-temperature ET study on a multi-phase alloy are shown in Figure 6. Since the data corresponds to the different phases, the multi-modal behavior is expected to be seen in both modulus and hardness of the material. The median of data is not being applied to report the overall properties at various temperatures, as the graphs do not follow normal distribution patterns. As illustrated in Figure 6a, the median of modulus increases up to 400 °C and then shows a sudden decrease at 500 °C in Young’s modulus of the material.
Again, a load was chosen to investigate the elastic/plastic response at a shallow, 300 nm depth in order to detect the properties of individual phases. Hardness measurements show a gradual decrease with increasing temperature related to the plastic deformation and softening behavior of the material at elevated temperatures. Figure 6 shows the distribution of modulus and hardness for a temperature range of 200-500 °C. In modulus histograms, the distribution of the data changes from multi- or bi-modal to nearly normal behavior. This might be because of the high diffusion rate of elements which drastically changes above 500 °C as reflected in the modulus data. However, understanding such behavior requires further compositional and microstructural analysis.
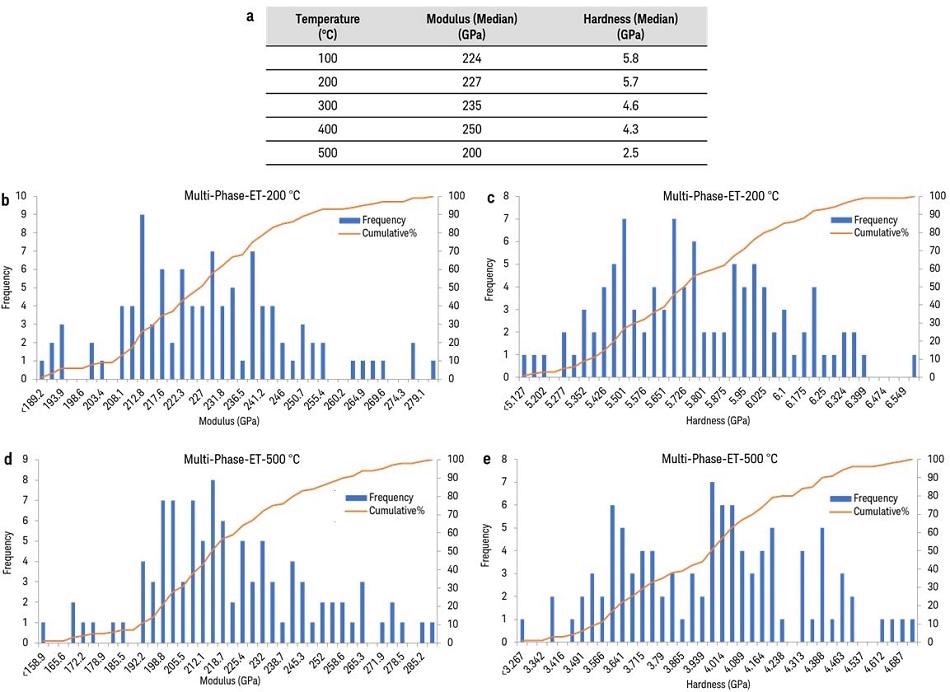
Figure 6. Median of modulus and hardness of an AlCrFeNiTi multi-phase alloy at different temperatures. Histograms of modulus and hardness are measured using the ET method.
High-Resolution Nanomechanical Properties Mapping
The modulus and hardness mapping of single-phase, as well as multi-phase alloys, is illustrated in Figure 7. Instead of selecting different locations to acquire the statistical data, a nanoindentation test was conducted within a specific area by controlling the indentation depth and spacing, to produce high-resolution maps. Although a single-phase alloy has only one phase, Young’s modulus of the material varies throughout the microstructure. These maps are created at room temperature on annealed microstructures after rapid cooling down from 500 °C.
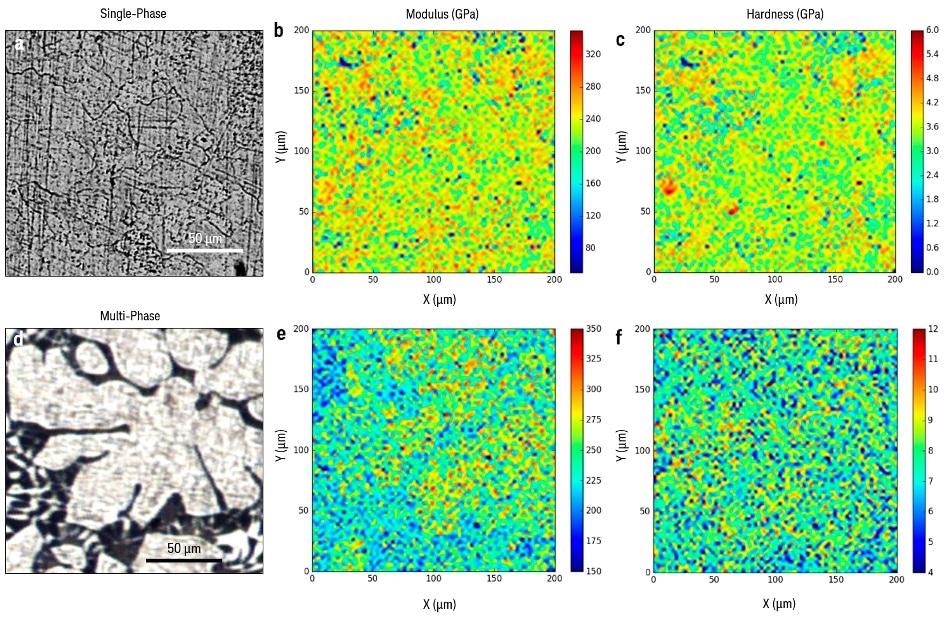
Figure 7. Mapping of high-resolution mechanical properties of multi-phase HEA alloys at room temperature after rapid cooling down from 500 °C.
The distribution of the modulus in maps for both materials perfectly matches the microstructures illustrated in Figure 7. Young’s modulus depends on the structure and orientation of the phases.
The modulus study is more reflective of the microstructure compared to the hardness study, which is a better reflection of the plastic deformation beneath the indenter. Clearly, different crystallographic orientations and grain boundaries exhibit different elastic properties in response to the nanoindentation.
Figure 8 illustrates the quantified modulus and hardness distributions corresponding to the mapping measurements presented in Figure 7. The graphs correspond to a very large dataset of 6400 indents per graph and they predominantly follow a normal distribution. There are, however, two detectable peaks in Young’s modulus graph for multi-phase alloy, relating to the two different phases in the microstructure.
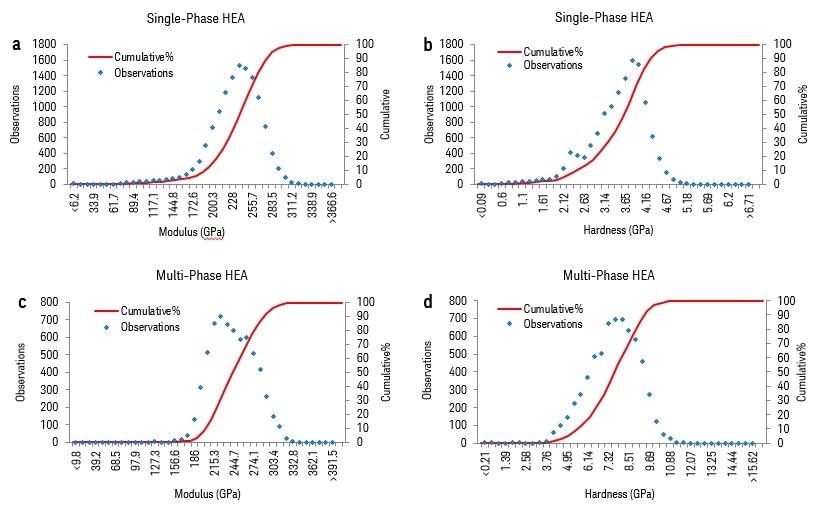
Figure 8. Modulus and hardness distributions from high-resolution mechanical properties mapping for single- and multi-phase HEA alloys at room temperature after rapid cooling down from 500 °C.
Conclusion
The ET method used in this study is a very fast and powerful method for statistical evaluation of the properties of HEA single-phase and multi-phase alloys. The properties of individual phases can be extracted by collecting a large data set of indents all over the microstructure. This method was also modified to dynamically measure the mechanical properties of materials at elevated temperatures with the Keysight’s G200 laser heater system. This method helps generate high-resolution mechanical property maps, which allows researchers to explore detailed mechanical property variations in materials with a one-to-one comparison with microstructural and compositional variations. The ET method can also be employed to make comparisons with the mechanical and mathematical modeling results.
Acknowledgment
The material for this article was prepared in University of Science and Technology of Beijing (USTB) in China. Professors Zhi Lin, Yong Zhang, Junpeng Liu are highly acknowledged in this collaboration.
References
[1] D.B. Miracle, O.N. Senkov. A critical review of high entropy alloys and related concepts. Acta Materialia, Vol 122 (2017), PP 448-511.
[2] Y.F. Ye, Q. Wang, J. Lu, C.T. Liu, and Y. Yang. High-entropy alloy: challenges and prospects. Materials Today, Vol 19 (2016), PP 349-362.
[3] KLA Application Note 5992-2475EN. High-Temperature Nanoindentation on Pure Titanium (Ti) (2017)
[4] KLA Application Note 5992-2518EN. Brittle-to-Ductile Plasticity Transition Behavior Study of Silicon using High-Temperature Nanoindentation (2017)
[5] KLA Application Note 5992-2555EN. Effect of Indenter Tip Heating in High-Temperature Nanoindentation Measurements (2017)
[6] KLA Application Note 5992-2711EN. Using High-Temperature Nanoindentation to Study Mechanical Properties of High-Entropy Alloys (HEA) (2017)
[7] Junpeng Liu, Youcheng Zhang, Xiao Yang, Michael Gao, Junpin Lin, and Yong Zhang. Phase Separation and High-Temperature Tensile Properties of Al0.5CrFeNiTi0.25 High Entropy Alloy. Science of Advanced Materials, Vol 8 (2016), PP 1-4.

This information has been sourced, reviewed and adapted from materials provided by KLA Corporation.
For more information on this source, please visit KLA Corporation.