Background
Numerous analytical methods provide scientists with critical insights into how the world works at the micro- and nanoscale. Each method offers distinct advantages, and combining multiple analytical techniques can be highly effective. PiFM (photo-induced force microscopy) is one of the only imaging methods able to deliver direct chemical data with sub-5 nm resolution.
Similarly, PiF-IR (photo-induced force infrared) spectroscopy is one of the few options for obtaining IR absorption spectra from monolayer materials. Beyond the technicalities, the real value of an instrument lies in its ability to help researchers answer essential scientific questions.
A recent Nature Communications publication used a range of methods for polyolefin catalyst analysis.1 Their aim was to investigate polyethylene formation on a catalyst model more relevant to industrial polyethylene fabrication. The data highlights how diverse, sophisticated nanoscale analytical instruments can complement one another to study complex chemical systems efficiently.
The Model
This study focused on polyolefin catalysts. Due to their hierarchical, complex nature, these catalysts are usually examined using a simplified planar model system, whereas highly spherical catalyst particles are used industrially.
To bridge the gap between spherical and planar catalyst models, the authors developed a spherical cap model that can be analyzed using all the methods in the micro-spectroscopy toolbox.
They examined a Ziegler-type catalyst spherical cap model based on a moisture-stable LaOCl framework engineered to support a TiCl4 pre-active site. This design was intended to be as consistent as possible with the industrially relevant MgCl2 framework, which is subject to technical and experimental limitations due to high sensitivity to moisture.
The LaOCl support matrix was designed to provide strong SEM imaging contrast because of the high atomic weight of lanthanides, and to maintain stability under ambient conditions.
The main objective of the novel spherical cap model designed in this study was to provide a system for studying the ethylene polymerization process ex-situ, while maintaining greater similarity to the highly spherical industrial framework.
The Micro-Spectroscopy Toolbox
In the study, the researchers used a variety of tools: IR PiFM, PiF-IR, Raman microscopy, FIB-SEM-EDX, XPS, and ToF-SIMS. These techniques were applied to investigate the interplay between the catalyst and the ethylene polymer phases formed after polymerization times ranging from one minute to an hour. Each tool provided different insights, adding valuable analysis.
Results Comparison
Results from Raman
The three vibrational (and therefore chemical) analytical methods used in the study were PiFM, PiF-IR, and Raman spectroscopy. Raman microscopy efficiently mapped the -CH stretching vibrations in the 2700-3100 cm-1 range. While this approach visualizes local thickness variations of the polyethylene synthesized in the spherical cap, its resolution is limited to just 360 nm in the best-case scenario.
Raman analysis showed polyethylene formation at the two-minute mark, clearly visible at the center and edges of the spherical cap, with stronger signals near the edges.
At longer time intervals (five, 20, and 60 minutes), Raman microscopy indicated the polyethylene layers grew more uniform across the spherical cap and became thicker. The authors concluded that the polyethylene yield increased as a function of polymerization time.
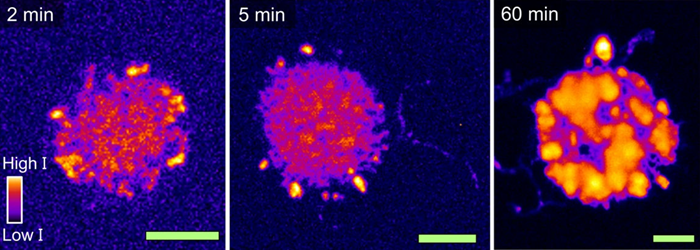
Figure 1. (Part of Fig. 3 from the publication) Raman microscopy to study formed polyethylene after 2, 5 and 60 min of ethylene polymerization. Due to its relatively low resolution, this Raman data can only show that the polyethylene yield increases as a function of polymerization time. The green scale bars all represent 10 μm. Image Credit: Molecular Vista
Results from PiFM
PiFM provided far higher spatial resolution than any other method in the study, exposing details invisible to Raman. It enabled mapping of the crystalline polyethylene via the -CH2- bending vibrations at 1461 cm−1 (B1u) and 1471 cm−1 (B2u).
These PiFM maps were correlated with the topographic information obtained by the AFM component of the Vista One instrument (referred to as a Vistascope).
The PiFM images validated the conclusions drawn from the Raman data; polyethylene thickness, and therefore yield, increased as a function of polymerization time. However, PiFM’s significantly higher spatial resolution revealed additional details that were not captured by Raman.
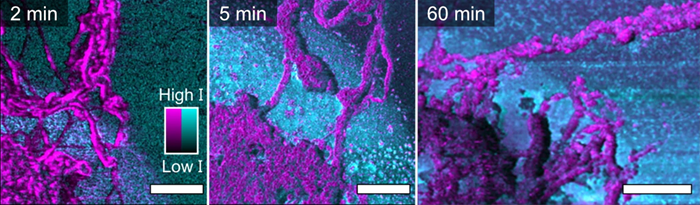
Figure 2. (Part of Fig. 3 from the publication) Here the PiFM images are a combination of two fixed-wavenumber scans which map the LaOCI and polyethylene distributions. The magenta intensity shows the distribution of the -CH2- bending modes that are associated with polyethylene. The cyan intensity represents some surface-adsorbed carbonate species that are associated with the LaOCI. Therefore, these images can directly show the surface chemistry. 2 μm scale bars are shown in white. Image Credit: Molecular Vista
Even at early polymerization times, well-defined, intertwined polyethylene fibers were observed growing outward from the LaOCl spherical cap, extending toward the Si(100) substrate. By 60 minutes of polymerization, the polyethylene layer had achieved a thickness of five micrometers.
The lower left corner of the 60-minute image depicts a LaOCl fragment in cyan lying on top of, and within, the magenta polyethylene fibers near the center of the spherical cap. While the overall conclusions drawn from PiFM and Raman data were similar, PiFM’s much higher resolution provided additional insights into sample morphology by allowing for more precise quantification of polyethylene fiber thickness.
Results from PiF-IR
PiF-IR refers to IR spectra collected using a PiFM instrument. For the 1- and 2-minute ethylene polymerization times, the doublet of peaks (1461 cm−1 and 1471 cm−1 absorption peaks associated with -CH2- bending) associated with crystalline polyethylene was absent. Instead, only a broad amorphous band at 1463 cm−1 was observed.
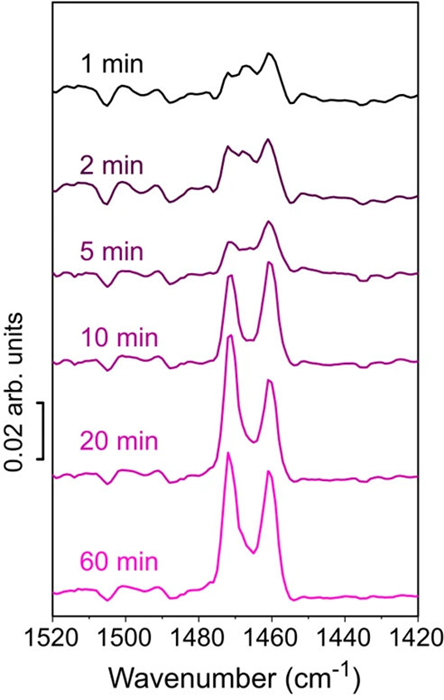
Figure 3. (Part of Fig. 3 from the publication) PiF-IR spectroscopy to study formed polyethylene as a function of ethylene polymerization time. Image Credit: Molecular Vista
Conducting a multivariate curve resolution (MCR) analysis on the PiF-IR spectra allowed the researchers to determine the fraction of the crystalline components that contribute to the spectra gathered for each polymerization time (Figure 4).
The results showed a steep increase in crystallinity up to 10 minutes, followed by saturation as the polymer formed a thicker HDPE-like PE layer.
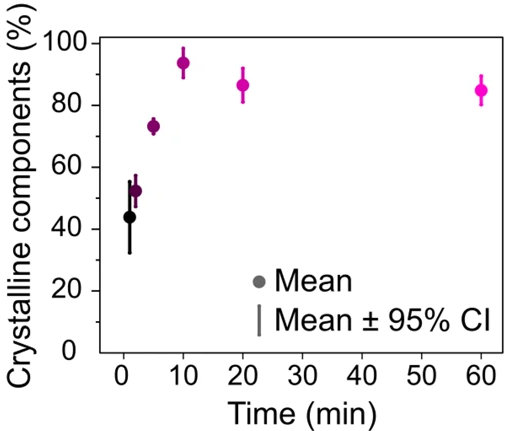
Figure 4. (Part of Fig. 3 from the publication) MCR analysis performed on the PiF-IR spectra from Fig. 3 shows the fraction of crystalline polyethylene present as a function of ethylene polymerization time. Image Credit: Molecular Vista
The PiF-IR spectra provided critical insight into the polymerization process that Raman imaging and PiFM imaging could not deliver alone. The findings in this study are even hypothesized to be linked to a conclusion based on the study’s ToF-SIMs data, discussed later.
Results from FIB-SEM-EDX
In addition to the chemical analysis of polyethylene fibers conducted using vibrational methods, FIB-SEM was used to examine sample morphologies as a function of polymerization time.
In the FIB-SEM images, a clear atomic contrast is visible between the low-atomic-weight polyethylene, the intermediate-atomic-weight Si(100) substrate, and the high-atomic-weight LaOCl framework through backscattered electron detection. This streamlined differentiation of these materials, even without any chemical data, and was a primary reason LaOCI was selected for this experiment.
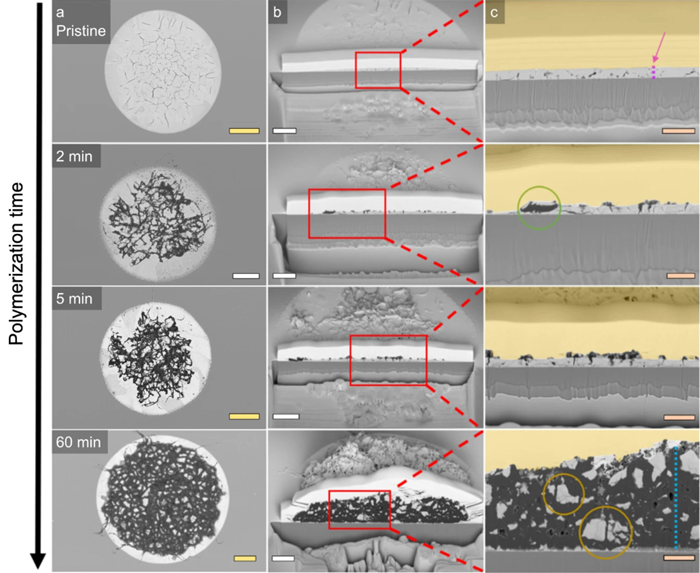
Figure 5. (Fig. 4 from the publication) Top-down and cross-sectional FIB-SEM images of the spherical cap morphology as a function of ethylene polymerization time. The yellow scale bars represent 10 μm, the white scale bars 5 μm, and the orange scale bars 2 μm. Image Credit: Molecular Vista
These images allowed the progressive fragmentation of the spherical cap matrix to be observed. Initially, the polyethylene fibers are extruded from cracks on the surface where they begin to locally peel off some of the LaOCI. This occurs primarily in the spherical cap’s center.
At the edges of the matrix, the polyethylene quickly fills internal macroporous cavities, cleaving the LaOCI from within. By 10-20 minutes, both fragmentation models are monitored throughout the spherical cap. Finally, at 60 minutes, the internal fragmentation model becomes the dominant fragmentation pathway.
Results from XPS
XPS was used to examine the LaOCl surface in pristine condition, after TiCl4 grafting, but before ethylene polymerization. Comparison of these measurements with bulk reference materials indicated that XPS provided evidence for Ti4+ coordination on the LaOCl surface. A minor presence of Ti3+ species was also observed.
Despite being useful for double-checking the synthesis of the spherical caps, XPS did not add any value when studying the catalyst itself.
Results from ToF-SIMS
Time-of-flight secondary ion mass spectrometry (ToF-SIMS) was employed to confirm LaOCl formation during synthesis of the spherical cap models. Additionally, this method was used to monitor surface chemistry, validating polyethylene formation at all of the polymerization times studied.
This was achieved by measuring the distribution of negatively charged fragments of LaOCl−, TiOCl−, and polyethylene-characteristic C21H31− via secondary electron images.
Furthermore, AFM and ToF-SIMS analysis in Figures S8 and S11 of the study demonstrated “a decay in the increase of the estimated polyethylene on the external surface after roughly two to five minutes.” This reduced polymerization rate could result in a higher ratio between the rate of crystallization and the rate of polymerization, aligning with PiF-IR spectroscopy and MCR observations.
Summary
In this study, the Raman, PiF-IR, and PiFM micro-spectroscopy toolbox enabled multiple significant observations regarding ethylene polymerization in the LaOCl catalyst matrix. Some methods, such as XPS and ToF-SIMS, proved especially valuable when synthesizing the LaOCl spherical caps.
While ToF-SIMS provided insights into polyethylene's polymerization rate, the most compelling observations regarding crystallization rate were made using PiF-IR spectroscopy. Raman was essential in identifying the locations of the strongest polyethylene formation during early polymerization stages.
Additionally, the high resolution of the PiFM images not only corroborated these findings but also revealed the polyethylene fiber structure itself. Quantification of polyethylene layer thickness was even achieved via PiFM and the AFM.
FIB-SEM images were also key to evaluating sample fragmentation behavior as a function of polymerization time. This was facilitated by the stark contrast of the atomic weights of their materials. Without that advantage, chemical techniques such as Raman or PiFM would have been necessary to observe the morphologies of materials with similar atomic weights.
Overall, this data presents a compelling set of results from each technique, and the study effectively highlights the strengths of the instruments in the micro-spectroscopy toolbox.
References
- Bossers, K.W., et al. (2022). A Ziegler-type spherical cap model reveals early stage ethylene polymerization growth versus catalyst fragmentation relationships. Nature Communications, (online) 13(1). https://doi.org/10.1038/s41467-022-32635-z.

This information has been sourced, reviewed, and adapted from materials provided by Molecular Vista.
For more information on this source, please visit Molecular Vista.