Advancements in nanotechnology have heightened the demand for analytical tools that can reveal the chemical makeup of newly created materials at the tiniest scales.
Electron microscopy can pinpoint atoms but struggles to show the molecular structures that define material behavior. Optical methods such as Raman and FTIR spectroscopy are widely used to identify molecules; however, their spatial resolutions are constrained by the diffraction limit, typically around one micron, which falls short of the requirements of nanotechnology and nanomaterial researchers.
Infrared photo-induced force microscopy (IR PiFM), which integrates atomic force microscopy (AFM) with IR spectroscopy, effectively overcomes the diffraction limit inherent to optical techniques.
Figure 1 illustrates the application of PiFM in the study of a polymer blend, specifically poly(lactic acid) (PLA) and acrylic rubber (ACM). The mix of biodegradable plastic and natural rubber creates a versatile material with greener credentials.
In practice, AFM topography (Figure 1a) is often acquired first, particularly when the sample constituents are unknown. Subsequently, several photo-induced force (PiF-IR) spectra can be obtained at distinct features within the topography, as demonstrated in Figure 1f.
These spectra exhibit several strong peaks above 1700 cm−1. The PiFM laser can then be tuned to a specific wavenumber to map the absorption response across the sample surface. Image 1b depicts the mapping of PLA through the PiFM response at 1750 cm−1.
The process can be repeated to obtain PiFM images that reveal unique features along with corresponding spectra (Figures 1c and 1d). Different PiFM scans can be color-coded and merged to build a detailed chemical map, as shown in Figure 1e, where three PiFM images at 1750, 1720, and 1070 cm−1 are color-coded blue, green, and red to represent poly(lactic acid), acrylic rubber, and a third component, respectively.
This results in a unified chemical map image. It is important to note that three distinct spectra are acquired from three locations indicated in Figure 1e and displayed in Figure 1f. PiFM can capture reliable chemical spectra from features as small as 10 nanometers.
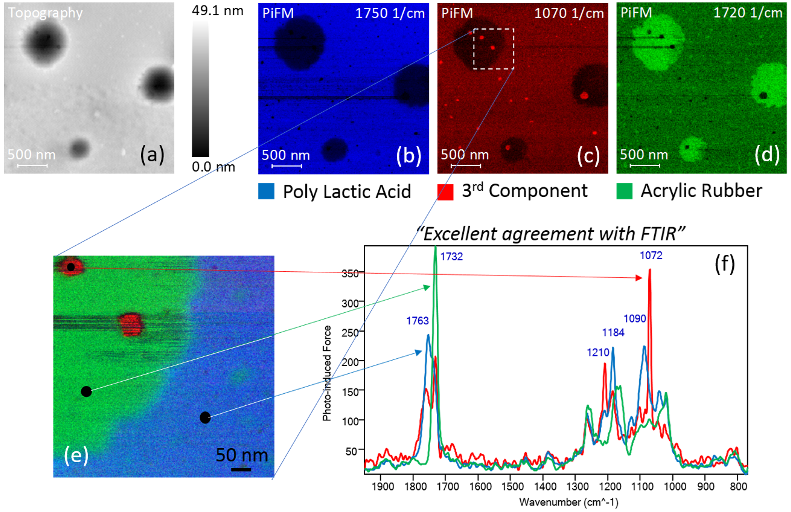
Figure 1. (a) Topography and PiFM images at (b) 1750 cm−1, (c) 1070 cm−1, and (d) 1720 cm−1 for PLA, 3rd component, and ACM respectively. A zoomed in (e) composite image consisting of three PiFM images and (f) three spectra from locations shown in (e). Image Credit: Molecular Vista
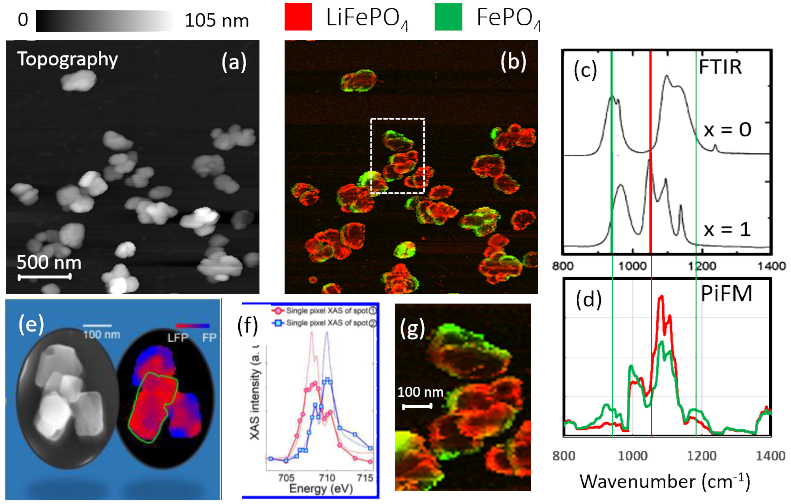
Figure 2. (a) Topography and (b) composite PiFM images at 1054 cm−1 (for LFP) and at 941 cm−1 (for FP); (c)FTIR spectra from reference 1; (d) PiFM spectra for green and red regions in (b); (e) and (f) XAS microscopy results from reference 2; and (g) digitally zoomed region defined by white dotted rectangle in (b) digitally zoomed region. Image Credit: Molecular Vista
PiFM is equally effective for inorganic materials. In the subsequent example, IR PiFM is used to investigate the chemical changes in lithium iron phosphate (LiFePO4) micro- and nanocrystals that occur during delithiation. Lithium iron phosphate (LiFePO4) is a widely used cathode material in lithium-ion batteries. X-ray absorption spectroscopy and microscopy have been used to elucidate the phase transition from LiFePO4 to FePO4, as such phase transition could jeopardize the structural integrity of the cathode.
Partially delithiated LiFePO4 (LFP) nanocrystals were analyzed using infrared photothermal-induced force microscopy (IR PiFM). Due to the small feature sizes, a hyperspectral IR PiFM (hyPIR) image consisting of 256 x 256 pixels with a scan size of 2.5 µm × 2.5 µm was acquired. Each pixel in the hyPIR scan contains its own spectrum, creating a dataset of more than 65,000 spectra.
Figure 2a presents the AFM topography of the nanocrystals. Figure 2b displays a composite image derived from two PiFM images, with red representing 1054 cm−1 and green representing 941 cm−1 extracted from the hyPIR image.
Figure 2c illustrates published FTIR spectra for Li x FePO4 at x = 1 and x = 0. Figure 2d presents two spectra, the averages of all spectra corresponding to the respective colored regions in Figure 2b; the green (red) spectrum represents the average of all spectra associated with the green (red) region in Figure 2b.
A comparison of Figures 2d and 2c reveals that the green and red spectra correspond to the x = 0 and x = 1 spectra, respectively. Notably, in the absence of lithium (x = 0), PiFM exhibits a peak between 930 and 950 cm−1, consistent with the FTIR results. At x = 1, a distinct shoulder appears in the PiFM spectrum at approximately 1050 cm−1, aligning with a prominent peak in the FTIR spectrum. The data in Figure 2b indicates that lithium removal begins at the outer edges of the nanocrystals.
Figure 2e presents the nanocrystalline morphology alongside a composite X-ray absorption spectroscopy (XAS) microscopy image, with red and blue representing LiFePO4 and FePO4, respectively. Figure 2f displays the X-ray absorption curves associated with the two crystalline phases.
Figure 2g provides a digitally zoomed image of the section outlined in the white rectangle in Figure 2b, allowing comparison with Figure 2e at the same magnification. The results demonstrate a strong correlation.
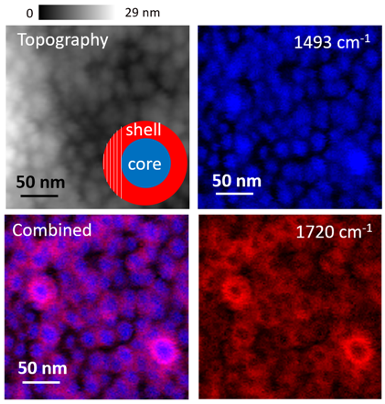
Figure 3. Topography and PiFM images of core-shell star block copolymer that consists of hydrophobic PS core and hydrophilic polymethacrylate shell. Image Credit: Molecular Vista
Subsequently, a core-shell nanoparticle structure commonly found in various applications was analyzed. For structures with an ultrathin organic shell layer, confirming the presence of the shell layer can be challenging.
With PiFM, the measured signal integrates over a thickness of approximately 20 nm. Therefore, if the shell layer is not thicker than about 10 nm, the core material should be detectable through the shell layer.
Figure 3 illustrates a core-shell star block copolymer consisting of a hydrophobic polystyrene (PS) core and a hydrophilic polymethacrylate shell. The AFM topography (top left image) reveals spherical structures without providing information about the presence of the shell layer, as would be the case with many other microscopy techniques.
When analyzing the sample at 1493 cm−1, the PS cores can effectively be imaged since the shell layer is relatively thin (<10 nm). At 1720 cm−1, the polymethacrylate shell appears as a donut shape, as the PiFM signal integrates over more material at the edges; the region shaded by white lines in the inset of the topography illustrates why the edges appear thicker, resulting in stronger PiFM signals.
When the two PiFM scans are combined, the core and shell become clearly visible, almost like a cross-section.
References and Further Reading
- A. Ait Salah, et al. (2006). FTIR features of lithium-iron phosphates as electrode materials for rechargeable lithium batteries. 65(5), pp.1007–1013. https://doi.org/10.1016/j.saa.2006.01.019.
- Yu, Y., et al. (2015). Dependence on Crystal Size of the Nanoscale Chemical Phase Distribution and Fracture in LixFePO4. Nano Letters, 15(7), pp.4282–4288. https://doi.org/10.1021/acs.nanolett.5b01314.

This information has been sourced, reviewed and adapted from materials provided by Molecular Vista.
For more information on this source, please visit Molecular Vista.