Charge is a critical property of proteins, nucleic acids, and nanoparticles, influencing biological processes, colloidal stability, and aggregation.1-3 While charge can be quantified in various ways, one of the most widely utilized metrics is zeta potential, defined as the electrokinetic potential at the slipping plane of a dispersed particle relative to the bulk fluid.
Zeta potential is contingent upon the analyte's ionizable groups and the characteristics of the surrounding solution, including ionic strength, temperature, and pH.
To obtain meaningful zeta potential measurements for biomolecules and nanoparticles, replicating or simulating the biological environments in which these entities operate is often essential, rather than relying on low or no-salt formulations.4 However, zeta potential measurements at elevated ionic strengths have historically posed challenges or have been deemed impractical due to limitations in instrument performance and the complexities of biomolecular electrostatics.
As a result, the scientific utility of zeta potential measurements has been constrained, particularly for high-precision applications such as developing quantitative models from experimental data.
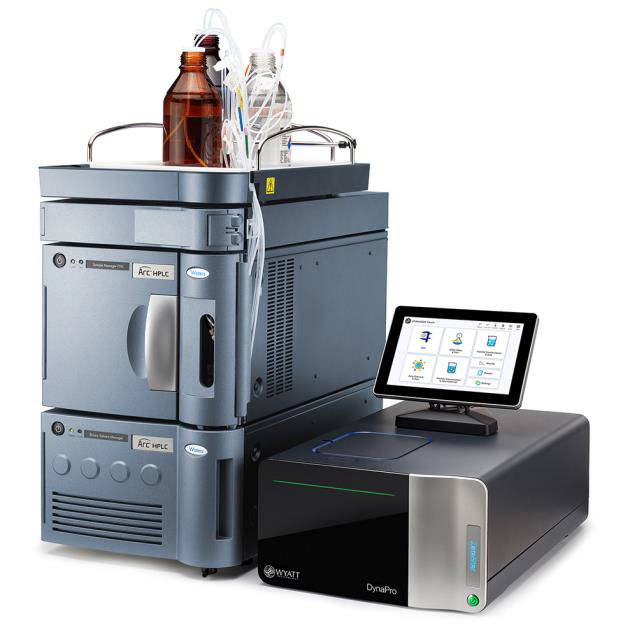
Figure 1. The DynaPro ZetaStar instrument can be operated either manually in microcuvette mode or combined with an Arc™ HPLC pump and sample manager. Image Credit: Waters | Wyatt Technology
The DynaPro ZetaStar instrument facilitates simultaneous dynamic light scattering (DLS) and electrophoretic light scattering (ELS) measurements, delivering highly sensitive and reproducible assessments of zeta potential, polydispersity, and size, even in demanding scenarios such as fragile samples that necessitate low electric fields, samples with low charge, or measurements in high ionic strength solutions.
Static light scattering (SLS) capabilities provide absolute measurements of particle concentration or molar mass. Utilizing the dip cell assembly, size, polydispersity, zeta potential, and particle concentration can be determined in a single workflow with only 65 µL of sample.
The process is completed in less than a minute, making it an optimal solution for dosing, stability, formulation, or lot-to-lot variability screening across product and process development cycles.
When paired with the Waters™ Arc™ HPLC and HPLC CONNECT™ software, zeta potential, size, and polydispersity measurements can be automated, requiring approximately 500 µL per measurement for routine analysis in quality control environments and facilitating the generation of large data sets necessary for constructing models of biomolecular and nanoparticle electrostatics.
In the study presented here, the ZetaStar instrument is employed to conduct automated high-precision measurements of liposomes and protein samples as a function of ionic strength, investigating how varying experimental conditions influence zeta potential, polydispersity, and size.
Materials and Methods
Samples and Buffer Conditions
Five neat liposome samples with increasing 1,2-dioleoylsn-glycero-3-phosphocholine (DOPC) content (Samples 1-5) were diluted 250-fold in the following solvents:
- Deionized water
- Unbuffered 10 mM NaCl
- Phosphate-buffered saline, pH 7.4 (PBS; 10 mM Na2HPO4, 1.8 mM KH2PO4, 2.7 mM KCl, 137 mM NaCl)
To quantify zeta potential as a function of ionic strength at a constant pH, 250-fold dilutions of liposome Sample 5 and 1.0 mg/mL bovine serum albumin (BSA) samples were prepared in 12 mM phosphate buffer (10 mM Na2HPO4, 1.8 mM KH2PO4, pH 7.4) containing 10 mM to 150 mM NaCl. All solutions used for dilutions were filtered through a 0.02 µm membrane prior to use.
Instrumentation
DLS and ELS measurements were conducted using a ZetaStar instrument connected to a Waters Arc HPLC, controlled by HPLC CONNECT software and automated via DYNAMICS™ software. For each measurement, 500 µL of the sample was injected into the flow cell.
Report averages and standard deviations are derived from triplicate injections unless otherwise specified.
Adaptive collection mode was activated to optimize applied current and measurement duration, employing a medium electric field strength for liposomes and a low electric field strength for BSA. Z
Zeta potentials were calculated using the Smoluchowski model for liposomes and the Henry model for BSA. Particle concentration was measured separately in PBS, pH 7.4, using a 45 µL quartz cuvette. All DLS, SLS, and ELS data acquisition and analysis were performed within the DYNAMICS software.
Results and Discussion
DLS measurements of liposomes in low (10 mM NaCl) and high salt conditions (PBS, pH 7.4) indicate that all samples possess similar hydrodynamic radii and concentrations.
No significant differences in size or polydispersity were observed between the low and high salt environments, and there were no indications of aggregation (see Table 1).
In contrast, the magnitude of the zeta potential was significantly lower in PBS compared to 10 mM NaCl for all samples (see Figure 2 and Table 1). This finding aligns with the expectation that charge screening is more pronounced at the higher ionic strength of the PBS solution relative to 10 mM NaCl.
The zeta potential increased with the DOPC content of the liposomes, with this effect being less pronounced, yet still significant, at higher ionic strength (see Figure 2).
These results underscore the necessity for high-precision measurements to accurately assess the impact of liposome formulation in relevant solvent environments.
To further investigate the effect of solvent composition on zeta potential, the liposome Sample 5 in deionized water was measured. Comparing the zeta potential of -56.9 ± 3.2 mV observed in water to the results from 10 mM NaCl and PBS, we found that introducing just 10 mM sodium chloride resulted in approximately a 50 % reduction in zeta potential (see Figure 3 and Table 1).
This observation is consistent with the expectation that the Debye length significantly decreases within the first few millimolar of salt concentration compared to pure water.
For instance, the Debye length is approximately 1000 nm at 10-4 mM ionic strength, compared to 3 nm and 0.8 nm at 10 mM and 150 mM ionic strengths, respectively.
Importantly, measurement precision remained robust across all three conditions, with relative standard deviations below 13 % (see Figure 3 and Table 1), allowing for measurements to be conducted in the relevant solvent without instrument limitations.
Table 1. Liposome size, polydispersity index, and zeta potential measured in unbuffered 10 mM NaCl and in PBS, pH 7.4. Particle concentrations were measured in PBS, pH 7.4 (averages and standard deviations from six replicate measurements). Source: Waters | Wyatt Technology
| Sample |
10 mM NaCl |
PBS |
Rh
(nm) |
PD
Index |
ζ
(mV) |
Rh
(nm) |
PD
Index |
ζ
(mV) |
Particle Concentration
(×1013 mL-1) |
| 1 |
45.4 ± 0.7 |
0.14 ± 0.06 |
-8.9 ± 0.9 |
43.2 ± 1.1 |
0.10 ± 0.03 |
-2.2 ± 1.1 |
1.1 ± 0.1 |
| 2 |
42.0 ± 0.8 |
0.18 ± 0.06 |
-16.2 ± 2.3 |
39.9 ± 1.2 |
0.17 ± 0.04 |
-4.5 ± 1.2 |
1.5 ± 0.1 |
| 3 |
41.4 ± 1.2 |
0.19 ± 0.08 |
-24.8 ± 2.8 |
39.4 ± 1.0 |
0.15 ± 0.04 |
-6.1 ± 0.9 |
1.6 ± 0.1 |
| 4 |
37.8 ± 0.4 |
0.15 ± 0.05 |
-28.9 ± 2.4 |
36.5 ± 1.0 |
0.18 ± 0.05 |
-7.6 ± 1.4 |
2.5 ± 0.2 |
| 5 |
37.2 ± 0.6 |
0.16 ± 0.05 |
-28.5 ± 2.7 |
35.3 ± 0.6 |
0.15 ± 0.04 |
-10.2 ± 1.3 |
2.4 ± 0.1 |
| Averages and standard deviations from triplicate injections. |
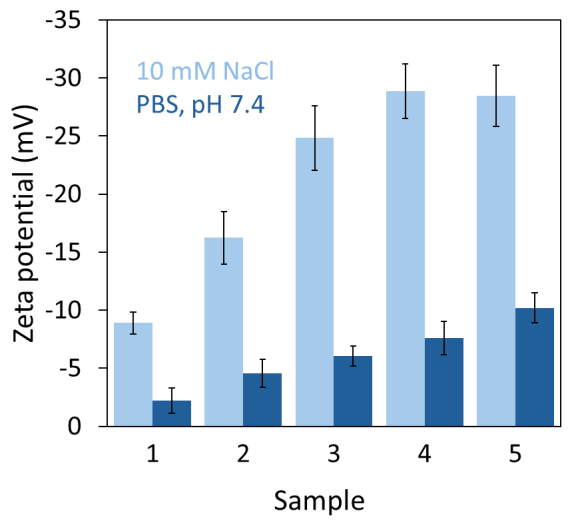
Figure 2. Results from automated zeta potential measurements in unbuffered 10 mM NaCl and in PBS, pH 7.4. Image Credit: Waters | Wyatt Technology
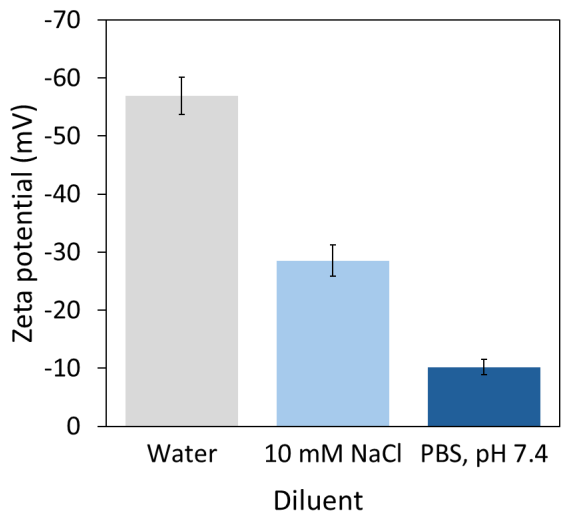
Figure 3. The measured zeta potential can depend strongly on the diluent. Example data for 250-fold dilution of liposome Sample 5. Image Credit: Waters | Wyatt Technology
When comparing results in water, 10 mM NaCl, and PBS, it is essential to recognize that the conditions differ in ionic strength and pH.
To isolate the effect of ionic strength, we conducted a separate experiment titrating the ionic strength using NaCl against a background of 12 mM phosphate buffer, pH 7.4 (see Figure 4).
As anticipated, a nonlinear decrease in zeta potential magnitude was observed as screening became more pronounced with increasing NaCl concentration, ultimately leveling off at approximately -10 mV above 100 mM added NaCl.
The relative standard deviation of 3-8 % is sufficiently low to utilize the data for high-resolution model building, if desired.
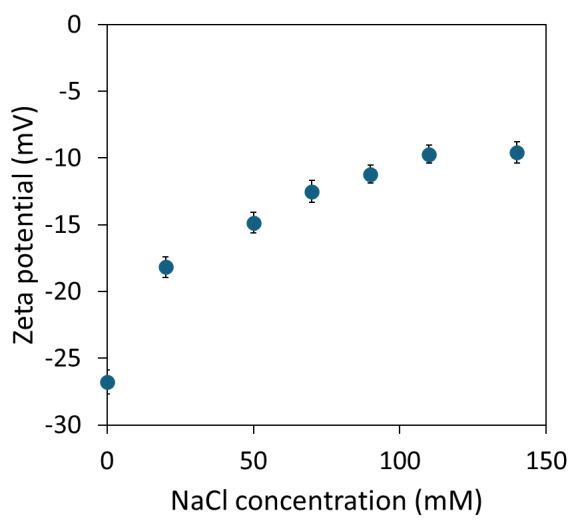
Figure 4. The zeta potential of liposome sample 5 as a function of NaCl concentration at pH 7.4. Image Credit: Waters | Wyatt Technology
The ionic strength titration for bovine serum albumin (BSA) was repeated to evaluate the performance with protein samples. The zeta potential of BSA decreased non-linearly in magnitude with increasing NaCl concentration, approaching a constant -20 mV at around 75 mM added NaCl (see Figure 5).
Since the ZetaStar instrument is capable of simultaneous DLS and ELS measurements, the protein’s hydrodynamic radius and polydispersity were monitored throughout the titration, confirming that the sample did not aggregate and remained undamaged by the applied electric field.
Such observations are vital for optimizing measurement conditions during method development.
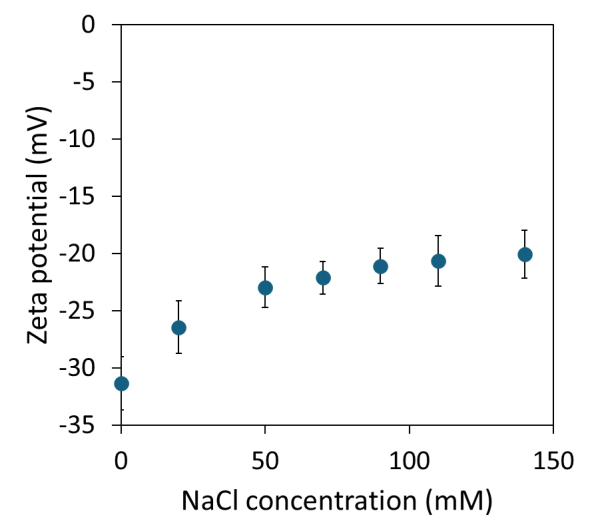
Figure 5. BSA zeta potential as a function of NaCl concentration at pH 7.4. Image Credit: Waters | Wyatt Technology
Conclusions
The results reported by the study presented here demonstrate that zeta potential is influenced by analyte chemistry and the solution environment. Given that solution ionic strength and pH can significantly affect net surface charge, it is crucial to measure zeta potential under appropriate solution conditions.
The ZetaStar instrument facilitates accurate, high-precision measurements across a broad range of ionic strengths, making it an ideal choice for biopharmaceutical development and for generating essential experimental data to enhance our fundamental scientific understanding of electrostatics in biology.
Acknowledgments
Produced from materials originally authored by Martin Kurnik, Shiva Ramini, Bretton Fletcher, Richard Chung, and Sophia Kenrick from Wyatt Technology, LLC.
References and Further Reading
- Estrada, E.V., et al. (2023). Diffusive intracellular interactions: On the role of protein net charge and functional adaptation. Current Opinion in Structural Biology, [online] 81, pp.102625–102625. https://doi.org/10.1016/j.sbi.2023.102625.
- Cohen, R.D. and Pielak, G.J. (2017). Quinary interactions with an unfolded state ensemble. Protein Science, 26(9), pp.1698–1703. https://doi.org/10.1002/pro.3206.
- Schreiber, G., Buckle, A.M. and Fersht, A.R. (1994). Stability and function: two constraints in the evolution of barstar and other proteins. Structure, 2(10), pp.945–951. https://doi.org/10.1016/s0969-2126(94)00096-4.
- Zhang, X. and Kenrick, S. (2024). AN6601: Measuring size, concentration, and zeta potential of LNPs with the DynaProTM ZetaStarTM - Waters | Wyatt Technology. (online) Available at: https://www.wyatt.com/library/application-notes/an6601-measuring-size-concentration-zeta-potential-lnp-with-dynapro-zetastar.html.

This information has been sourced, reviewed and adapted from materials provided by Wyatt Technology.
For more information on this source, please visit Wyatt Technology.