Sponsored by EntegrisReviewed by Olivia FrostFeb 18 2026
Single-particle optical sensing (SPOS) was originally developed for the field of particulate contamination analysis. Particles in a liquid suspension flow through a small "photozone", a narrow, slab-like region of uniform illumination, produced by light from a laser diode.
The particle suspension is sufficiently dilute when the particles pass, one at a time, through the illuminated region, avoiding coincidences. The passage of a particle through the sensing zone causes a detected pulse, the magnitude of which depends on the mean diameter of the particle.
The illumination/detection system in the sensor shown in Figure 1 is designed to provide a monotonic increase in pulse height with increasing particle diameter. Both an extinction and scattering detector are used to extend the dynamic range down to 0.5 micron. A particle size distribution (PSD) is constructed one particle at a time, by comparing the detected pulse heights with a standard calibration curve, obtained from a set of uniform particles of known diameters.
The SPOS technique possesses several characteristics that make it ideal for measuring the PSD of a wide variety of particle suspensions, emulsions, and dispersions. These include exceptional resolution, wide dynamic range, and high accuracy.
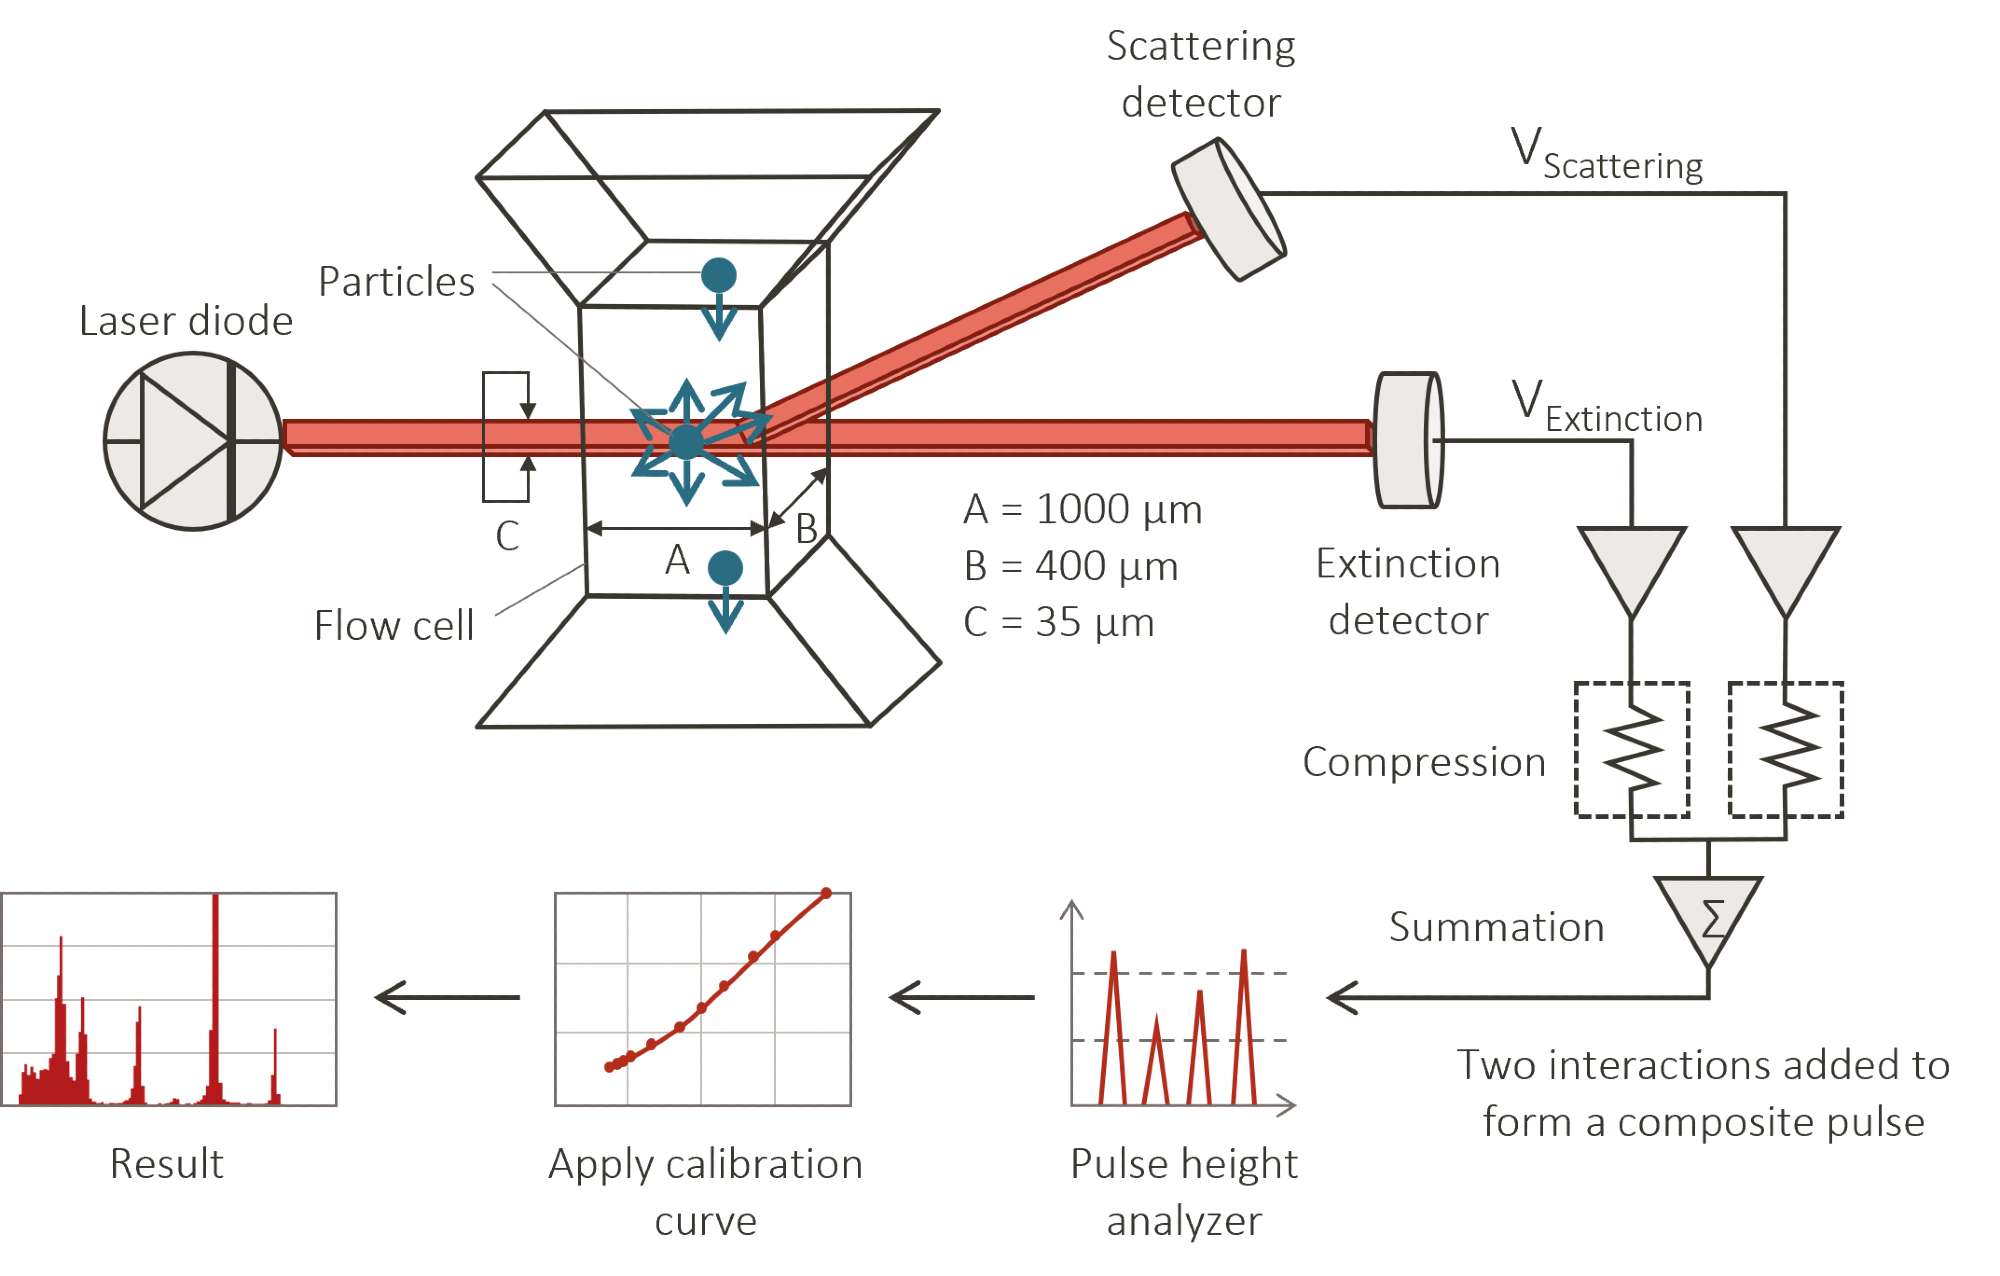
Figure 1. Results reported include both the particle size distribution and concentration (particles/mL). Image Credit: Entegris
Because of this, the instruments can be used both as a liquid particle counter for contamination applications, as a general particle size analyzer, and as a hybrid technique to quantify tails of distributions. The instrument is used as a contamination counter in a variety of industries and applications, including subvisible particulate contamination in parenteral drugs, ophthalmic solutions, parts cleaning, water purification, and filter testing. In these areas, the instrument typically measures the residual contamination in filtered liquids.
Because the system provides up to 1024-size channels, it can also be used as a high-resolution particle size analyzer of suspensions or powders dispersed in liquid.
Figure 2 shows the particle size distribution of a pharmaceutical active ingredient (API) powder dispersed in water. Note that this graph plots the volume distribution vs. size, whereas in contamination counting applications, the number result is used (1).
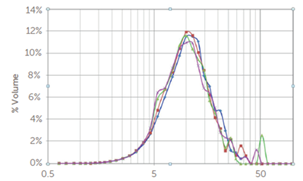
Figure 2. Particle size distribution of an API powder dispersed in water. Image Credit: Entegris
An additional capability is the ability to quantify the tails of distributions in high-concentration suspensions such as emulsions, chemical mechanical polishing (CMP) slurries, and inkjet inks. Here, the instrument doesn’t determine the entire particle distribution, just the coarse, large particles at the large side of the distribution.
Contamination Counting in Parenteral Drugs
Parenteral drugs are medications administered through routes other than the gastrointestinal (GI) tract, typically via injection or infusion, allowing them to enter the bloodstream more quickly and reliably than oral medications.
The United States Pharmacopeia (USP) and other agencies, such as EP, JP, and ChP, have established test methods to minimize particle counts in intravenous injections (parenteral drugs) and ophthalmic solutions. Particulate matter is both unwanted contamination and a potential health risk to the patient. Tests are in place for both visible and subvisible particulate matter. Subvisible particulate matter tests include USP <787>1, <788>2, <789>3, and <729>4.
Tails of Distributions
The “tail” of a particle size distribution refers to particles several standard deviations removed from the mean of the standard Gaussian distribution. Figure 3 shows the properties of a Gaussian distribution where 95.5 % of the total population lies within plus or minus two standard deviations (σ) of the mean (μ). The tails could be defined as the 2.25 % of the distribution outside two standard deviations from the mean.
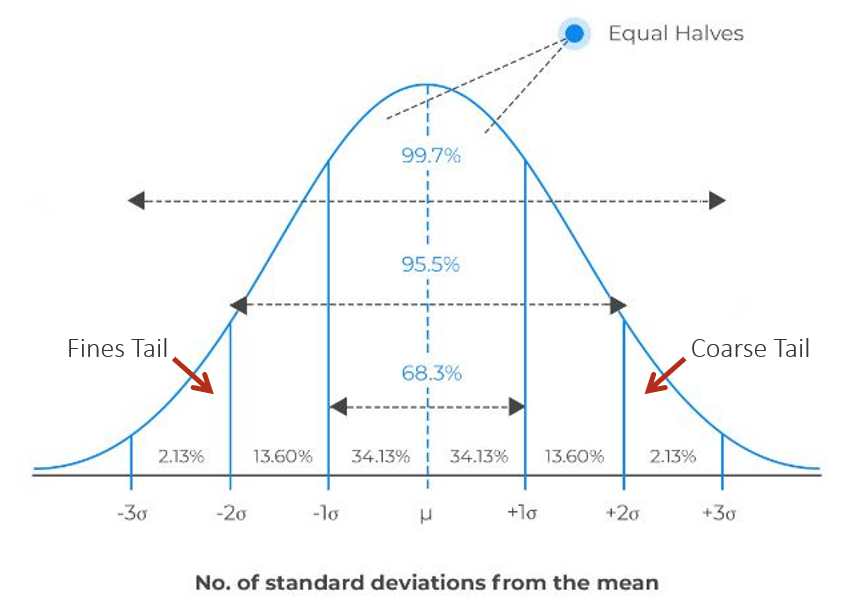
Figure 3. Image Credit: Entegris
Inkjet Inks
Inkjet inks are colloidal dispersions of pigments in solution. Proper dispersion of pigments is necessary to prevent sedimentation, instability, or inkjet nozzle failure caused by agglomeration. Assuring optimum formulation and manufacturing requires a reliable method to determine the particle size distribution of the final product. The Nicomp® dynamic light scattering (DLS) system can be used to determine the mean size and zeta potential of ink dispersions. The AccuSizer® single particle optical sizing (SPOS) system is ideal for determining if the final inkjet ink contains any oversized particles (tails) that pose a risk for clogging jets and causing other reductions in performance.
References
- United States Pharmacopeia (USP) (n.d.) USP–NF General Chapter <787> Subvisible particulate matter in therapeutic protein injections. USP–NF. United States Pharmacopeial Convention, Rockville, MD. Available at: https://doi.org/10.31003/USPNF_M6497_02_01
- United States Pharmacopeia (USP) (n.d.) USP–NF General Chapter <788> Particulate matter in injections. USP–NF. United States Pharmacopeial Convention, Rockville, MD. Available at: https://www.uspnf.com/sites/default/files/usp_pdf/EN/USPNF/revisionGeneralChapter788.pdf
- United States Pharmacopeia (USP) (n.d.) USP–NF General Chapter <789> Particulate matter in ophthalmic solutions. USP–NF. United States Pharmacopeial Convention, Rockville, MD. Available at: https://doi.org/10.31003/USPNF_M99587_01_01
- United States Pharmacopeia (USP) (n.d.) USP–NF General Chapter <729> Globule size distribution in lipid injectable emulsions. USP–NF. United States Pharmacopeial Convention, Rockville, MD. Available at: https://doi.org/10.31003/USPNF_M99505_02_01

This information has been sourced, reviewed, and adapted from materials provided by Entegris
For more information on this source, please visit Entegris