Graphene's remarkable characteristics and diverse applications have sparked interest in its study. Only graphene sheets with a few layers show interesting, unusual features. Raman spectroscopy is an efficient method for determining the layer thickness of graphene sheets.
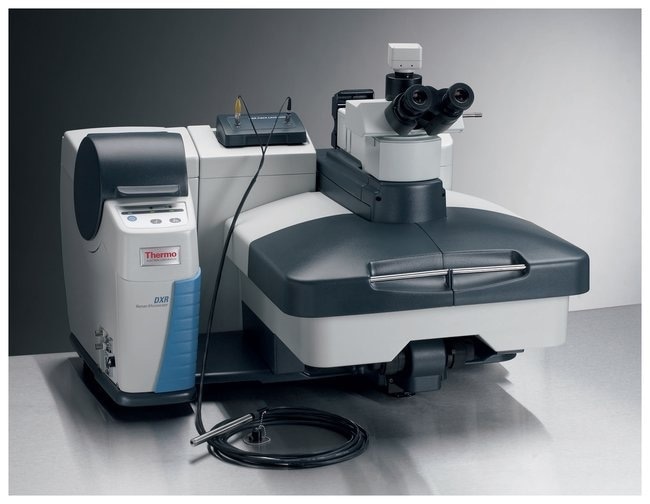
Image Credit: Thermo Fisher Scientific - Vibrational Spectroscopy
Raman Spectroscopy and the Raman Spectrum of Graphene
Raman spectroscopy, which is sensitive to geometric structures, is used to examine carbon allotropes that differ only in the nature of bonding and carbon atom location. It can also differentiate multilayer graphenes and provide atomic layer resolution for thicknesses of up to four layers.
The spectra show basic structures with two fundamental G bands and two D bands (a third D band if the carbon lattice has flaws). When examined closely, these minor deviations reveal vital information. Figure 1 displays the Raman spectra of graphene and graphite.
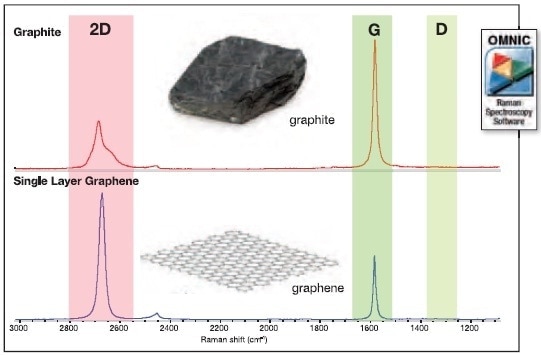
Figure 1. The Raman spectra of graphite and angle-layer graphene collected with 532 nm excitation. Image Credit: Thermo Fisher Scientific - Vibrational Spectroscopy
The G Band
The sharp band in the graphene spectrum about 1587 cm-1 is the G band, an in-plane vibrational mode involving sp2 hybridized carbon atoms that make up the graphene sheet.
The observed position and predictable behavior of this band aid in determining layer thickness, as the G band position is very sensitive to the number of layers present in the sample (Figure 2).
Small quantities of strain on the sample, doping, and temperature can all influence band location, whereas intensity is less affected by these factors.
As a result, one must exercise caution when attempting to utilize the position of this band to calculate graphene layer thickness, as intensity with these external parameters is more reliable. Figure 3 shows the spectra of single, double, and triple-layer graphene.
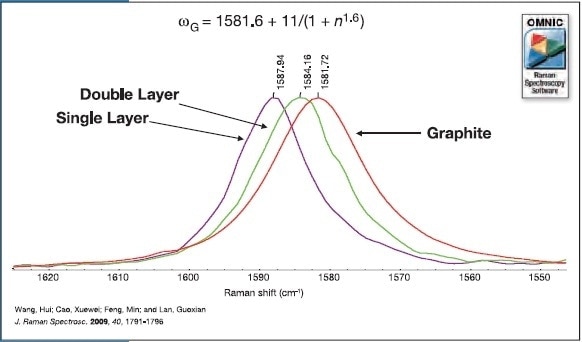
Figure 2. The G band position as a function of layer thickness. As the number of layers increase the band shifts to lower wavenumber, collected with 532 nm excitation. Image Credit: Thermo Fisher Scientific - Vibrational Spectroscopy
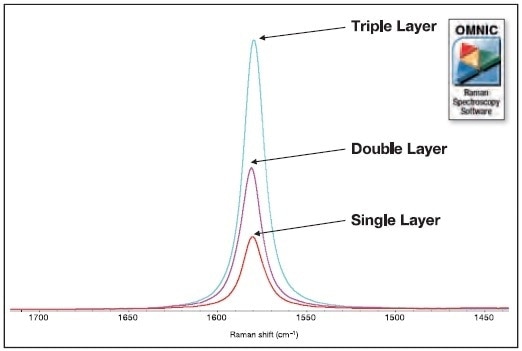
Figure 3. There is a linear increase in G band intensity as the number of graphene layers increases, collected with 532 nm excitation. Image Credit: Thermo Fisher Scientific - Vibrational Spectroscopy
The D Band
A ring breathing mode derived from sp2 carbon rings represents the D band, disorder, or defect band. To be active, the ring must be located near a graphene edge or defect. This band is often weak in graphite and contains high-quality graphene.
Only defective materials have a substantial D band and a resonant band with dispersive behavior. As a result, if the D band is used, it is critical to use the same excitation laser frequency for all measurements as the position and form of the band can vary dramatically between excitation laser frequencies.
The 2D Band
The last band, the 2D band, is the second-order D band, which is produced by a two-phonon lattice vibration process. Unlike the D band, being close to a defect does not trigger it.
As a result, the 2D band is always a strong band in graphene, even when no D band is present, and it does not reflect defects. Unlike the G band position approach, the 2D band method is based on band position and shape.
Figure 4 shows the variances among the strata in this band. The various band shape characteristics allow the 2D band to effectively distinguish between single and multilayer graphene with fewer than four layers.
Because the 2D band is resonant and shows high dispersive behavior, its position and form can vary dramatically with varied excitation laser frequencies. As with the D band, it is critical to use the same excitation laser frequency for all measurements while doing characterization in the 2D band.
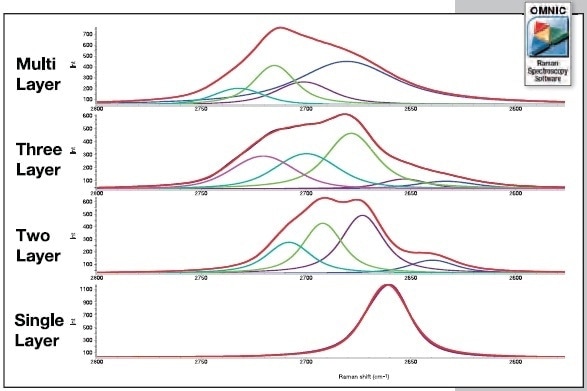
Figure 4. The 2D band exhibits distinct band shape differences with the number of layers present. Image Credit: Thermo Fisher Scientific - Vibrational Spectroscopy
Figure 5 shows how the peak intensity ratio of the 2D and G bands can be used to identify single-layer graphene. For high-grade (defect-free) single-layer graphene, the I2D/IG ratio will be equal to 2. This ratio, the absence of a D band, and the sharp symmetric 2D demonstrate that the graphene sample is of high quality and defect-free.
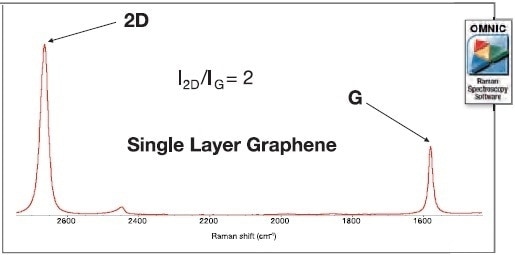
Figure 5. Single-layer graphene can be identified by the intensity ratio of the 2D to G band. Image Credit: Thermo Fisher Scientific - Vibrational Spectroscopy
Instrumental Considerations
The essential factors to consider while selecting a Raman instrument are:
- Graphene samples require microscopy due to their small size.
- Select a visible excitation laser (633 or 532 nm).
- High wave number precision and resolution allow for accurate observation and power adjustment in small increments.
- Automated stage and software for generating Raman point maps.
The DXR 2 Raman systems have an unparalleled capacity to fine-tune laser power due to a laser power regulator, which maintains laser power with unprecedented accuracy and can be tuned for each experiment.
The Raman Mapping of Graphene
When an automated stage is integrated into the Raman microscope, Raman maps or images can be generated from the sample.
Raman mapping is the synchronized measurement of Raman spectra with sequential movements. Figure 6 shows the results of a Raman map measurement using Thermo Scientific's OMNIC Atlas mapping software.
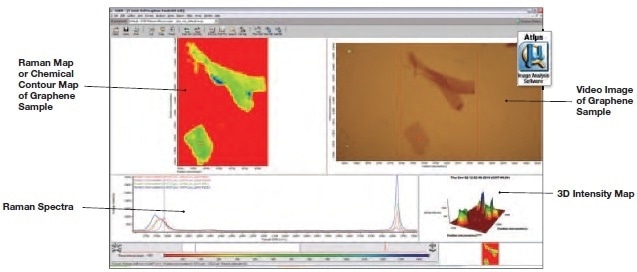
Figure 6. Raman spectra of graphene at specific locations exhibiting differences in layer thickness. Image Credit: Thermo Fisher Scientific - Vibrational Spectroscopy
Powerful processing algorithms, such as discriminant analysis in OMNIC™ Atlμs™ and Thermo Scientific TQ Analyst software, may identify locations in the map with different graphene layer thicknesses. A calibration set consists of standard spectra for various layer thicknesses.
The 2D band with its band form differences is employed in discriminant analysis since there are different differences.
Figure 7 shows the results of the discriminant analysis performed on this map. It demonstrates that the sample under inquiry consisted of single, double, triple, and multilayer graphene areas.
Conclusions
Raman spectroscopy provides more information on the structure of graphene samples than any other technique. Raman spectroscopy is an excellent method for characterization of graphene, particularly layer thickness. Thermo Scientific™ Raman Microscopes are well suited for graphene characterization, offering high stability, precise control, and sensitive detection to support accurate and reproducible results.

This information has been sourced, reviewed and adapted from materials provided by Thermo Fisher Scientific - Vibrational Spectroscopy.
For more information on this source, please visit Thermo Fisher Scientific - Vibrational Spectroscopy.