Terrain mapping is a Raman imaging technique that adjusts the vertical position of the microscope stage to ensure the sample remains in focus while data is collected across irregular or tilted sample surfaces.
A tightly focused laser spot provides higher laser power density, providing increased Raman intensity from the analysis volume. It is also possible to ensure good spatial resolution and Raman intensity by maintaining a tight laser focus while moving across a sample.
A key advantage of Raman imaging is its capacity to visualize components’ spatial distribution across a sample area.
The interpretation of Raman intensity can be complicated by variations in sample focus during imaging, because it can be challenging to differentiate changes in intensities related to the sample itself from changes caused by fluctuations in sample focus.
A significant loss of spatial resolution and Raman intensity can also impact Raman spectra quality and the ability to utilize the spectral data as a tool for spectral or spatial identification.
Flat samples are generally the most ideal for Raman imaging due to the focus being preserved when moving across the sample. It is not always practical or possible to produce flat samples, however, because some samples’ physical nature may prevent the generation of a microscopically flat surface.
Samples like coatings may be damaged or removed entirely when aiming to produce a flat surface, or it may not be possible to modify the sample because it must remain intact and unaltered.
The methods required for producing microscopically flat samples are sometimes too complex and time-consuming to be practical, even if there are no restrictions in terms of what can be done to prepare a sample.
A means of imaging sloped, rough, or uneven samples is necessary, and this can be achieved using methods such as terrain mapping.
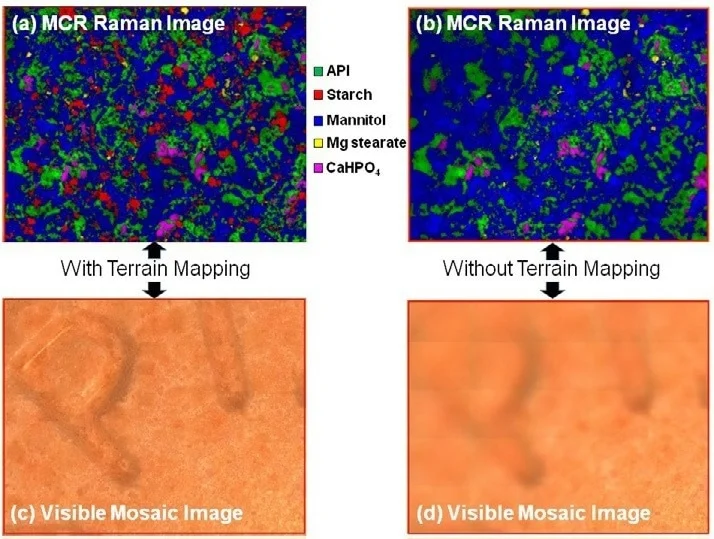
Figure 1. Raman imaging of a tablet surface with and without terrain mapping. A) Multivariate curve resolution (MCR) Raman image collected with terrain mapping. B) MCR Raman image collected without terrain mapping. C) Composite visual mosaic image using terrain mapping. D) Visual mosaic without terrain mapping. Image Credit: Thermo Fisher Scientific - Vibrational Spectroscopy
Figure 1 shows the effect of terrain mapping, showing a curved tablet with letters stamped into its surface. Sample focus is maintained across the sample surface when using terrain mapping, and this can be clearly observed when comparing the visual mosaic images.
The maintenance of good sample focus also impacts the Raman MCR (multivariate curve resolution) image, with the image collected via terrain mapping demonstrating much improved definition of the sample components.
It can be observed that the component particles in the image without terrain mapping are not as distinguished, with several component particles missing entirely.
This article outlines the use of terrain mapping in the analysis of thin films (patinas) formed on uneven copper surfaces.
Patinas can also be intentionally created to give objects the appearance of age or to create colors or textures, or they can form via natural exposure to environmental conditions such as air, salt water, or acid rain.
Copper patinas form due to oxidation of the exposed surface, but the precise nature of the formed compounds depend on how the patinas develop.
The formation mechanism and, thus, the source of the patinas can be indicated by the presence of different copper oxides (Cu2O and CuO), as well as carbonate, chloride, hydroxide, nitrate, and sulfate.
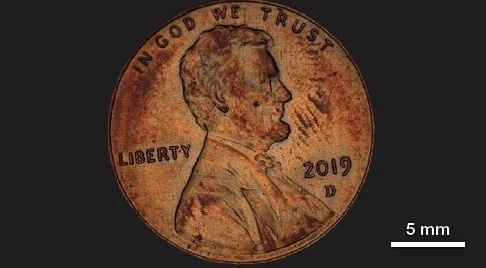
Figure 2. United States one-cent coin (penny). Image Credit: Thermo Fisher Scientific - Vibrational Spectroscopy
Experimental
The samples in this work are United States one-cent coins (pennies) (Figure 2). The minting process of these coins leads to raised numbers and letters above the surface of the penny, offering an easily recognizable example of the use of terrain mapping with uneven surfaces.
The current version of the penny is comprised of a copper layer over a zinc interior. A total of four pennies were intentionally exposed to an array of conditions to generate various patina types. These patinas were created intentionally, but they do involve constituents found in patinas that commonly occur naturally.
A Thermo Scientific™ DXR3xi Raman Imaging Microscope was used to image sections of the coins.
This was done using the Thermo Scientific OMNICxi Software’s terrain mapping feature. A 455 nm laser was used because this generated spectra with the optimal combination of high Raman intensity and low fluorescence artifacts.
The first stage of the terrain mapping process involves the collection of visible mosaic images of the sample at various focal points, covering the lowest to highest points in the area of interest.
This data will then be used to generate a terrain mosaic combining pixels from the different in-focus points to produce a composite visual image containing all the points in focus.
The in-focus points’ vertical stage positions are employed during Raman data collection to ensure that the Raman spectra are acquired with the sample surface in focus.
The focal position information is also retained, allowing a 3D representation of the sample surface to be displayed. Raman imaging data can be superimposed on top of this 3D representation.
Results
Table 1. Sample treatment conditions and terrain mapping details. Source: Thermo Fisher Scientific - Vibrational Spectroscopy
| Penny |
Conditions |
Focal range (µm) |
Interval (µm) |
Objective |
Figure |
| 1 |
Gentle heating (150 °C, 30 min) |
150 |
3 |
20x |
3 |
| 2 |
Heating to 250 °C |
95 |
0.7 |
50x |
6 |
| 3 |
Ammonia vapor (room temperature) |
74 |
0.7 |
50x |
8 |
| 4 |
Exposure to carbon dioxide in air |
31 |
3 |
20x |
10 |
Table 1 details the conditions used in patina generation, alongside the parameters used for collecting the terrain mosaics.
The focal range can be understood as the total vertical distance the stage was moved from the highest to the lowest focal point. This range was based on the sample’s highest and lowest points in the area of interest.
The interval shows the increments that the stage position was moved through the focal range. This value is based on the objective’s depth of field. These figures illustrate both a 2D and 3D representation of the terrain mosaics.
Table 2 details the parameters utilized for Raman data collection and the identified components.
The step size can be understood as the horizontal spacing between points across the sample surface. This is generally selected based on the size of the area analyzed and the objective used. The figures show Raman images generated via the spectral data superimposed on top of the 3D representations of the terrain mosaics.
Table 2. Raman imaging parameters and components identified. Source: Thermo Fisher Scientific - Vibrational Spectroscopy
| Penny |
Area imaged
(µm) |
Step size (µm) |
Number of spectra |
Components |
Figure |
| 1 |
3475 × 1535 |
10 |
53592 |
Cu2O |
4 |
| 2 |
940 × 630 |
5 |
24003 |
Cu2O, CuO |
7 |
| 3 |
930 × 1040 |
5 |
39083 |
Cu2O, Cu(OH)2 |
9 |
| 4 |
1515 × 1580 |
10 |
24168 |
Cu2O, CuCO3(OH)2 |
11 |
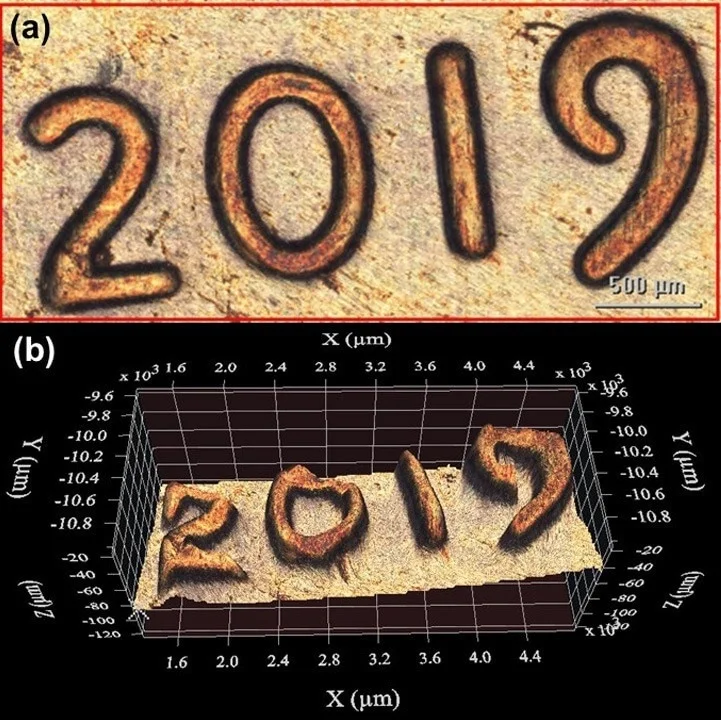
Figure 3. Visible terrain mosaic from Penny 1. A) 2D image. B) 3D image with the z-axis expanded to demonstrate surface topography. Image Credit: Thermo Fisher Scientific - Vibrational Spectroscopy
Penny 1 was gently heated until it was possible to observe a subtle change in surface coloration. Figure 3 features an area of this penny with a slightly tilted surface and raised numbers specifying the year the penny was minted. The figure’s z-axis has been expanded to better show the sample’s topographical features.
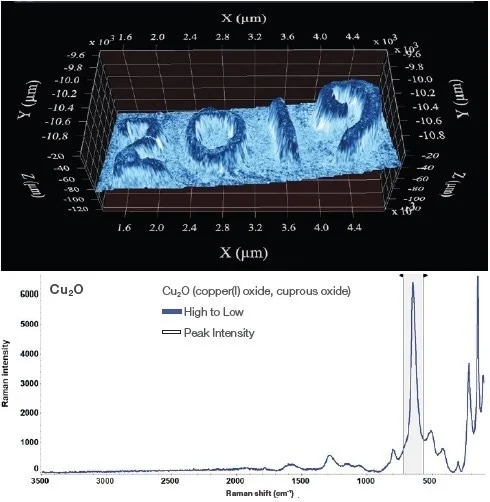
Figure 4. Raman peak area intensity image from Penny 1 based on the Cu2O peak at 645 cm-1. Image Credit: Thermo Fisher Scientific - Vibrational Spectroscopy
Figure 4 shows a Raman image generated from the peak area intensity of the 645 cm-1 peak associated with Cu2O. This peak was detected with varying intensity across the entire surface.
The darker blue areas highlighted in the figure signify a higher concentration on the tops of the numbers versus the lighter blue and white areas. It is important to mention copper metal itself is not Raman active, but its thin oxide coating that allows for Raman visualization.
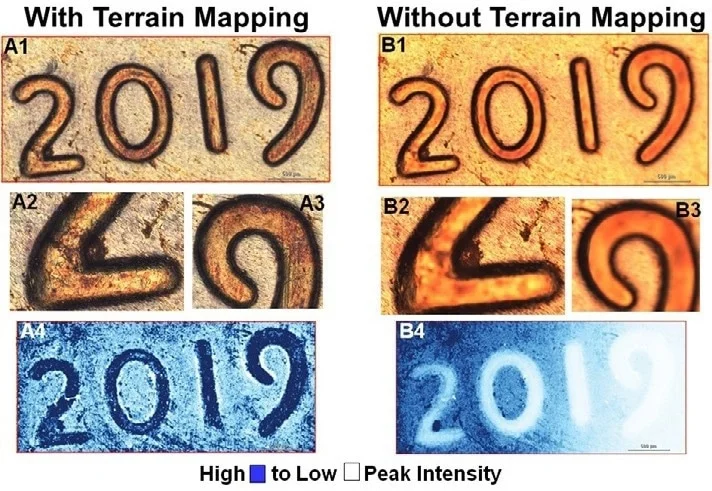
Figure 5. Comparing results collected with terrain mapping (A1-A4) and those collected at a single focal point without terrain mapping (B1-B4). A1-A3 and B1-B3 are visual mosaic images. A4 and B4 are Raman images based on the peak area of Cu2O at 645 cm-1, where the darker blue color indicates higher peak intensity and white represents lower peak intensity. Image Credit: Thermo Fisher Scientific - Vibrational Spectroscopy
Figure 5 highlights the benefits of terrain mapping. Using a single focal point for collecting both the visual (Figure 5B 1-3) and Raman (Figure 5B 4) images results in considerably poorer results than those achieved via terrain mapping (Figure 5A 1-4).
A loss of visual detail can also be observed, as well as a notable loss of Raman peak intensity. The raised numbers and sample tilt seen in Figure 3 and Figure 4 clearly impact both the Raman and visual data.
The images presented in Figure 5 were collected using a 20x objective. The impact of sample topography would likely be even more pronounced at higher magnifications.
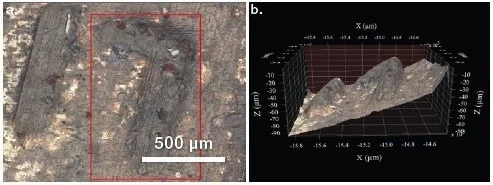
Figure 6. Visible terrain mosaic from Penny 2. A) 2D image. B) 3D image with the z-axis expanded to demonstrate surface topography. Image Credit: Thermo Fisher Scientific - Vibrational Spectroscopy
Cupric oxide (CuO) is also product of copper oxidation, as well as Cu2O. Heating Penny 2 at a higher temperature resulted in the production of a darker color that is consistent with CuO formation.
Figure 6 features the terrain mosaic of the letter “L” in the word “liberty” on Penny 2. Raman analysis of this sample also confirmed the presence of both Cu2O and CuO.
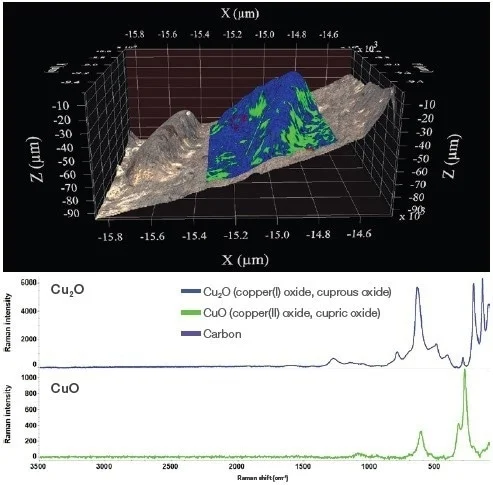
Figure 7. Raman MCR image from Penny 2 with Cu2O shown in blue and CuO shown in green. Image Credit: Thermo Fisher Scientific - Vibrational Spectroscopy
Figure 7 features a Raman image generated from a multivariate curve resolution (MCR) analysis of the Raman spectra. MCR analysis is ideally suited to the identification of different components where there is no prior knowledge of their spectral features.
A number of carbon spots were also observed, potentially resulting from organic material present on the penny decomposing during heat treatment.
Blue copper (II) hydroxide (Cu(OH)2) can form when copper or bronze surfaces are exposed to basic solutions. Copper hydroxide is amphoteric, meaning it will dissolve in some aqueous solutions.
Penny 3 was exposed to aqueous ammonia vapors in order to produce a patina containing Cu(OH)2.
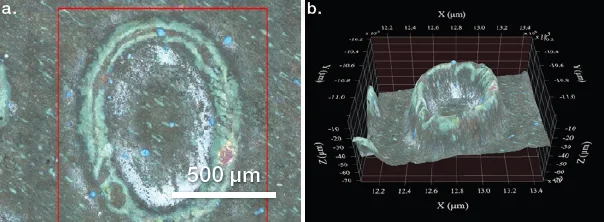
Figure 8. Visible terrain mosaic from Penny 3. A) 2D image. B) 3D image with the z-axis expanded to demonstrate surface topography. Image Credit: Thermo Fisher Scientific - Vibrational Spectroscopy
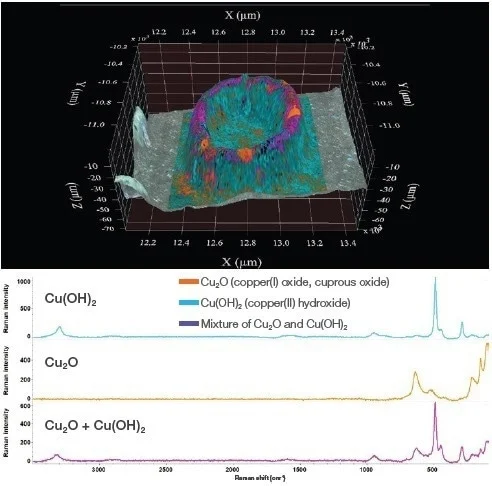
Figure 9. Raman MCR image from Penny 3 with Cu2O shown in orange and Cu(OH)2 shown in cyan. Mixtures of both are indicated in purple. Image Credit: Thermo Fisher Scientific - Vibrational Spectroscopy
Figure 8 features a terrain mosaic of a “0” embossed on Penny 3. Raman analysis of this area highlighted the presence of Cu(OH)2 on the copper surface.
Figure 9 shows an MCR Raman image, with Cu2O present in the orange areas, Cu(OH)2 concentrated in the blue areas, and purple areas featuring a mixture of both components.
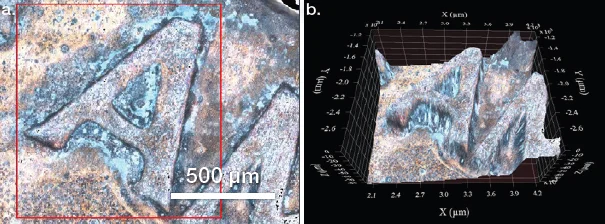
Figure 10. Visible terrain mosaic from Penny 4. A) 2D image. B) 3D image with the z-axis expanded to demonstrate surface topography. Image Credit: Thermo Fisher Scientific - Vibrational Spectroscopy
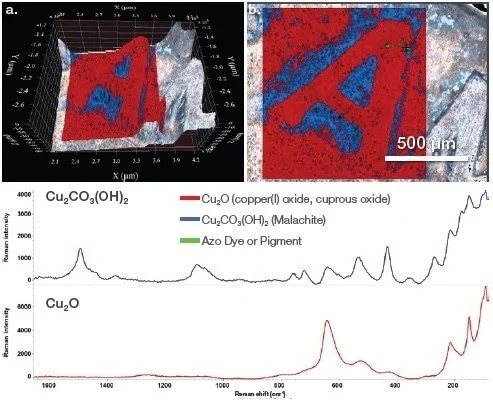
Figure 11. Raman MCR image from Penny 4. Cu2O is shown in red and Cu2CO3(OH)2 is shown in blue. A) Raman data superimposed on the 3D terrain mosaic. B) Raman data superimposed on the 2D terrain mosaic. Image Credit: Thermo Fisher Scientific - Vibrational Spectroscopy
Copper hydroxide can be found as a component in copper patinas, but is more likely to appear in cases where the patina slowly forms over time.
Carbon dioxide from the air will form copper hydroxides containing carbonate, for example, minerals like azurite (Cu3(CO3)2(OH)2) and malachite (Cu2CO3(OH)2).
Figure 10 features a terrain mosaic of the letter “A” embossed on Penny 4. Figure 11 shows the MCR Raman image of this area. It was possible to detect Cu2CO3(OH)2 around the base of the letter “A”, with Cu2O predominantly detected on top of the letter.
Some small spots were also detected, highlighted by the green areas in the image. These spots appear to be a type of azo dye or pigment. It is interesting that this dye or pigment was present on the surface of the penny, because this was not anticipated.
Conclusions
It is not always feasible, practical, or desirable to flatten samples for Raman analysis for a range of reasons. It is, therefore, highly beneficial to have a means of preserving sample focus and retaining both Raman intensity and spatial resolution during the Raman imaging of irregular surfaces.
Coins have surface structures formed during the minting process. This article showcases the use of terrain mapping via the analysis of patinas on a series of copper pennies. Copper patinas were intentionally produced via surface oxidation under a range of different conditions.
It is possible to extend the ideas and techniques presented here to the study of a wide range of thin films on numerous materials. Terrain mapping applications may include, but are not limited to, the study of metal corrosion, art and cultural heritage objects, and thin films on irregular surfaces.
Acknowledgments
Produced from materials originally authored by Thermo Fisher Scientific.

This information has been sourced, reviewed, and adapted from materials provided by Thermo Fisher Scientific - Vibrational Spectroscopy.
For more information on this source, please visit Thermo Fisher Scientific - Vibrational Spectroscopy.