Carbon nanomaterials are becoming increasingly important, and Raman spectroscopy is gaining attention due to the large amount of information it can deliver. Before beginning the characterization of carbon nanomaterials using Raman spectroscopy, certain facts must be considered.
First, the effect of excitation laser power on carbon nanomaterial samples must be understood. Accurate control of excitation laser power is critical. DXR Raman Instruments from Thermo Scientific provide the necessary control.
Impact of Laser Power
Laser power can have two types of impacts. Firstly, an excitation laser may modify or damage the sample when used with certain materials. The laser may burn a hole in the sample or inflict slight damage. This may result in spectra that do not represent the genuine sample.
Figure 1 shows one such case involving a C60 fullerene sample.
When only 0.5 mW of laser energy is supplied, C60 begins to break down into different structures, such as amorphous carbon. C60 is a very sensitive carbon nanomaterial. However, surface changes to materials such as carbon nanotubes may be less laser-tolerant than the underlying materials themselves.
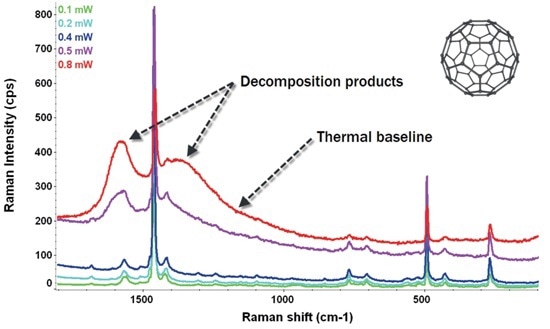
Figure 1. Effect of increasing laser power on C60 (532 nm excitation laser). Image Credit: Thermo Fisher Scientific - Vibrational Spectroscopy
Second, the laser strength may affect the sample temperature. The Raman spectra of several carbon nanomaterials are extremely sensitive to even minor temperature variations.
Figures 2 and 3 show two examples of multiwall carbon nanotubes and singlewall carbon nanotubes, demonstrating how even modest variations in laser power can affect Raman spectra by causing temperature changes in the material.
Because most of these carbon nanomaterials are black, they absorb a significant quantity of light, which is converted to heat and so changes the sample temperature.
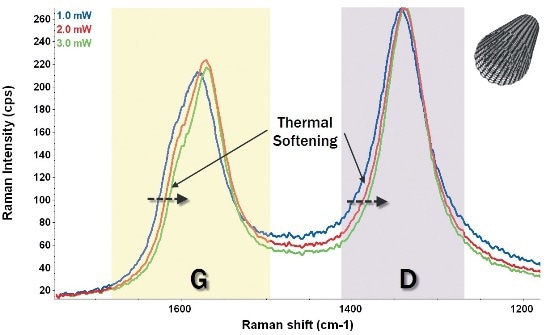
Figure 2. Effect of thermal softening with increasing laser power on multiwall carbon nanotubes (532 nm excitation laser). Image Credit: Thermo Fisher Scientific - Vibrational Spectroscopy
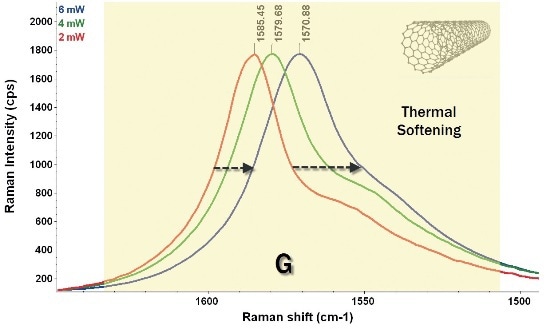
Figure 3. Effect of thermal softening with increasing laser power on singlewall carbon nanotubes (780 nm excitation laser). Image Credit: Thermo Fisher Scientific - Vibrational Spectroscopy
Both instances show large alterations in the G-band, with some movement from the D-band in the multiwall carbon nanotube case.
In the example shown in Figure 2, increasing the laser power from 1 mW to 2 mW reduces the D-band/G-band intensity ratio by 6 %, and increasing the laser power from 2 mW to 3 mW reduces the intensity ratio by another 3 %.
This may or may not have an impact on the quality assessment, depending on how tight the tolerances are, but it does increase the variability in the measurement.
Solutions
There are some relatively straightforward solutions to mitigating these effects.
Initially, when new materials or materials with new modifications are being tested, it is beneficial to start with very low power.
If several samples of the same material are expected, it is advised that a small portion of one sample be examined for laser tolerance. Spectra at various laser powers are gathered to assess how much power can be supplied without causing harm to the Raman spectrum.
Once the upper laser power limit that the material can safely withstand is determined, measurements can be taken with confidence.
The second aspect to consider is temperature management. It is important to avoid excitation of a sample area that is bigger than the detector's collection and focus zone. Any area of the sample exposed to the laser but out of view of the detector produces only heat rather than a Raman signal.
Thermo Scientific's DXR Raman Instruments ensure that the laser spot size on the sample is comparable to or slightly less than the detector's area.
This type of optical design offers exceptional control over temperature effects. The DXR Raman systems also contain a revolutionary auto alignment technology, which ensures that these areas remain precisely aligned.
Sample temperature can also be regulated by precisely regulating laser power at the sample and altering it in small increments. DXR Raman instruments have a laser power regulator. This unit employs a gradient-neutral density filter that may be tuned with great precision.
This is combined with a laser power meter that is calibrated to the sample position so that the laser power is continuously checked and adjusted to ensure that the set power and delivered power match.
Thus, the laser power may be accurately regulated within 0.1 mW increments, providing both assurance and a wide range of options for optimizing measurement conditions.
Figure 4 shows the concept of a laser power regulator.
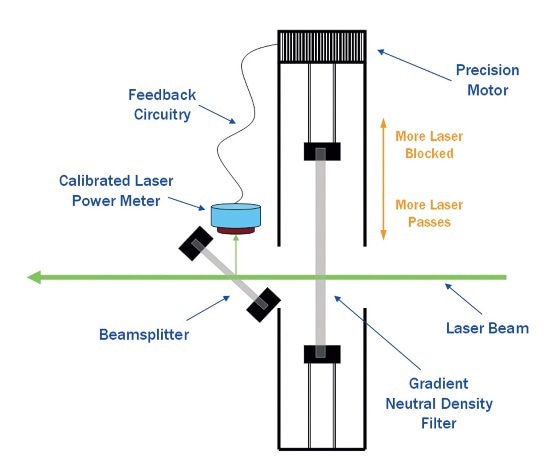
Figure 4. Principle of operation of the Thermo Scientific Laser Power Regulator. Image Credit: Thermo Fisher Scientific - Vibrational Spectroscopy
Finally, several carbon nanomaterial samples require very low excitation laser power. The amount of heat created on the sample can be minimized, making thermal effects easier to control.
As the laser power, and thus the heat generated at the sample, increases, so does the variability in the spectra caused by temperature effects.
If the laser power is kept low and no significant quantity of heat is generated, the sample will dissipate the heat more efficiently, stabilizing spectral fluctuations.
It is important to work with low laser power and low Raman emissions, hence a system that can function well under these conditions is required. The ability to keep a system well aligned is critical for achieving high sensitivity under low Raman emission conditions.
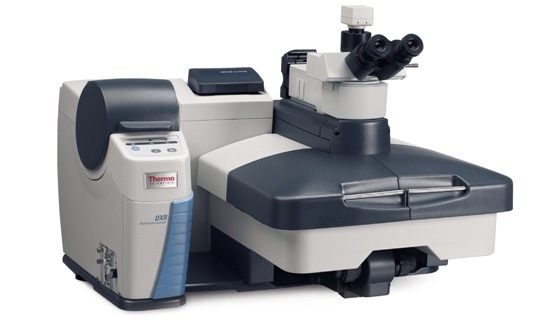
Figure 5. Thermo Scientific DXR Raman microscope. Image Credit: Thermo Fisher Scientific - Vibrational Spectroscopy
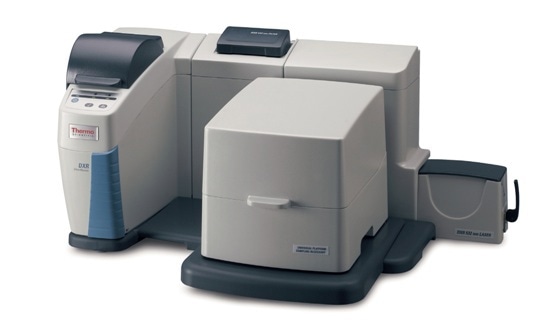
Figure 6. Thermo Scientific DXR SmartRaman spectrometer. Image Credit: Thermo Fisher Scientific - Vibrational Spectroscopy
Conclusions
Raman spectroscopy is an extremely effective tool for characterizing carbon nanomaterials. However, it is important to precisely manage the laser power to avoid sample damage and the introduction of additional variability into the data.
Thermo Scientific DXR Raman instruments offer a superior level of laser power control and excellent sensitivity with low laser power, integrating all the benefits of Raman with the precise control over measurement parameters essential for confidence in the results.

This information has been sourced, reviewed and adapted from materials provided by Thermo Fisher Scientific - Vibrational Spectroscopy.
For more information on this source, please visit Thermo Fisher Scientific - Vibrational Spectroscopy.