DOI :
10.2240/azojono0117
Oct 3 2007
Carbon nanotubes and nanopipes have been shown to have great potential as cellular probes, for use as nanofluidic devices to transport solutions to or from cells. Making these nanopipes able to sense within the cells allows a huge of amount of additional information to be obtained. Surface-enhanced Raman spectroscopy (SERS) is a technique allowing greatly increased Raman signals used for trace detection and characterization of biological specimens with extremely high spatial resolution. In this work, both carbon nanotubes and nanopipes have been functionalized with SERS-active nanoparticles to allow development of versatile nanoprobes. Glycine was used to estimate the SERS activity and corresponding enhancement factor (108).
Background
Carbon nanotubes (CNTs) have shown great potential for use as cellular probes. As “nanopipes” they can be used to transport liquids to or from cells and inject solutions or drugs directly into individual cells and individual organelles within the cells. In addition, because of the small diameters of the carbon nanotubes induce little damage to cells upon penetration. Carbon nanopipes (CNPs) have been filled with water [1], liquid crystals [2], fluorescent [3], and magnetic nanoparticles [4] showing that they can be used for the transport of different types of fluids to and from cells. By making these probes able to sense within the cells, information about chemical interactions within the cells could be found. Surface-enhanced Raman Spectroscopy (SERS) has this capability. Making carbon nanotubes SERS-active by functionalization with SERS-active nanoparticles, creates the possibility of extremely sensitive study and identification of components of cells. In addition, the nanotubes can be applied to a nanofluidic device where they can serve as an interconnection between a fluid reservoir and the cell, to both deliver and extract fluids. The effects of the fluids on the cells could be studied in situ.
The SERS technique can be used to enhance the Raman signal by factors of up to 1014 [5]. It has two main purposes; the first, to enhance the relatively weak Raman signal which makes it difficult to examine detailed chemical content of many complex specimens, and the second, to get information from the surface of complex materials (monolayers). In SERS, lateral resolution is determined not by the diffraction limit, but by the spatial confinement of the local fields [6]. This trace analytical capability is most interesting for biological studies, allowing molecular identification at the nanoscale. This is especially important because biologically relevant molecules are often available for characterization in extremely small amounts. There are two main mechanisms for the SERS enhancement, electromagnetic and chemical [7-10]. The electromagnetic enhancement concerns the excitation of surface plasmons on nanoscale metal structures, while the chemical enhancement concerns a charge-transfer complex between the metal and the sample to be analyzed.
Usual methods of creating the enhancement necessary for SERS are roughened or patterned metal plates, or spherical nanoparticles. However, these utilize “hot-spots” to create the significant enhancement factors desired. Preliminary results have shown that spherical nanoparticles embedded in the walls of carbon nanotubes produce a weak but observable signal [11].
It has been shown that faceted nanoparticles give a much higher SERS intensity than colloidal nanoparticles [12] due to quadrupole [13] and gradient field effects [14] and so are used in this study. These can relax the selection rules, and cause the appearance of normally forbidden Raman lines, explaining some of the changes observed in the SERS spectra.
Faceted nanoparticles can create these hot-spots individually, removing the need for precise control of aggregation [15].
Results and Discussion
Two kinds of nanoprobes were created and tested. First, CNPs with nanotriangles attached inside, that allow study of interactions inside the tubes. A suspension of CNPs in ethanol and a solution of the nanotriangles was prepared, allowing the triangles to spread inside the CNPs. Before use, a droplet of this suspension was placed onto a silicon wafer and allowed to dry thoroughly. Although no triangles were observed on the surface of the CNPs with transmission electron microscopy (TEM), the CNPs were gently washed with DI water to remove any triangles on the surface. Nanotubes were observed using backscattered electron imaging with scanning electron microscopy (SEM) to scan for gold particles, which did not appear on the outside of the tubes. After evaporation of the water, the glycine solution was deposited onto the CNPs. Because the CNPs are large in diameter, individual tubes were clearly visible.
Second, narrow multi-wall nanotubes with triangles chemically attached to the outside by the Bingel reaction [16]. The Bingel reaction is an example of a [2+1] cycloaddition reaction. The main steps in the process are: First, the nanotubes were immobilized on a surface and transesterified by prolonged stirring in an excess of 2 (methylthio)ethanolfollowed by extensive washing with diethyl ether to form [(COOCH2CH2SMe)2C<SWNT]. Then, by exploiting the gold sulfur binding interaction the cyclopropane group was “tagged” using gold nanoparticles. Samples mixed without the Bingel reaction showed no attachment of triangles to the nanotubes.
Similarly, the CNTs with triangles attached were deposited on a silicon wafer and washed gently with DI water. After evaporation, glycine was deposited onto the CNTs. Raman spectra were taken from small clusters of nanotubes, containing as few as visible with the instrumental setup used.
Any superfluous glycine remaining around the nanotubes during the Raman measurements does not affect the results. The concentration of glycine is too low to be observed by conventional Raman spectroscopy, making it only observable when in contact with the nanotriangles which are only inside the CNT or CNPs. All spectra of glycine were taken while wet, to prevent the formation of crystallites on the surface of the tube during the drying process.
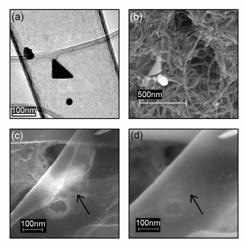 Figure 1. Microscopy of nanotube probes. (a) TEM picture of a triangle and spherical particle inside a nanopipe. (b) SEM image of a triangle and a hexagonal particle attached to MWNT by the Bingel reaction. (c) An SEM image of a triangle inside a nanopipe made transparent by the high voltage (25 kV). (d) An SEM image of the same nanopipe as in (c) with an accelerating voltage of 4 kV, showing nothing in the region of (c), meaning that the triangle is located on the inside of the tube.
A nanotube used to obtain SERS was brought to SEM and observed, showing a triangle on the inside of the nanotube. With an accelerating voltage of 4 kV, no particles were observed, but when raised to 25 kV the walls of the tube became transparent, allowing observation of the triangle, shown in Figure 1.
Corresponding Raman spectra from these two methods are shown in Figure 2. The glycine peaks visible are identical in both cases, and correspond well with previous literature on SERS of glycine. Also visible are the Raman spectra of the CNPs and CNTs, consisting of a band around (1350 cm-1), which is a double resonance band common for carbon materials (D band) and a band around 1600 cm-1 related to in-plane vibrations of graphite (G band). These bands appear different between the CNTs and CNPs because of the difference in their synthesis [17] – the CNTs are mostly graphitic, while the CNPs have a disordered wall structure.
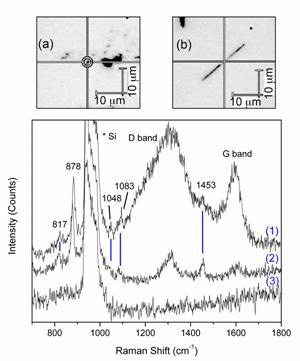 Figure 2. Raman spectra obtained by using nanotube probes. (1) from CNPs with triangles on the inside, (2) from MWNT with triangles attached to the outside, and (3) with no nanotube present, showing the lack of any signal besides from Si. (a) An image of a small cluster of MWNT used to obtain SERS. (b) An individual nanopipe used to obtain SERS.
Four additional peaks from glycine appear, at 817 – 872 (NH2 twist – CH2 twist), 1048 (C-N stretch), 1083 (NH3+ wag), and 1453 (CH2 bend) cm-1. The differences between the regular Raman and SER spectra can be explained by the gradient field and quadrupole effects, as discussed above.
Table I. Frequencies (cm-1) and assignments of bands in the conventional Raman spectra and SERS of glycine.
|
|
|
|
816 s, 872 w
|
817 w, 872 s
|
NH2 twist + CH2 twist
|
|
901 s
|
950 w
|
|
C-C stretch
|
|
1033 w
|
1026 w
|
1048 w
|
C-N stretch
|
|
1131 w
|
1175 s
|
1083 w
|
NH3+ wag
|
|
|
1229 w, 1273 m
|
|
|
|
1328 s
|
1311 w
|
|
CH2 wag
|
|
|
1374 w
|
|
C-NH3+ stretch
|
|
1407 s
|
|
|
COOH sym. stretch
|
|
1438 m
|
1437 w
|
1453 m
|
CH2 bend
|
|
1513 w
|
1527 s
|
|
NH3+ sym. def.
|
|
|
1590 w
|
|
COOH asym. stretch
|
|
1612 m
|
|
|
NH3+ asym. def.
|
Dou et al. demonstrated that glycine interacts with gold nanoparticles through the amino groups [18] which are therefore more affected by the plasmon-generated electric field. Comparison of these results to SERS of glycine in an Au colloid solution shows an upshift of about 5-10 cm-1 of the glycine peaks. In addition, observed SERS peaks correspond well with ab initio calculations from Kumar et al [19].
The enhancement appears to be small, but clearly distinguishable, being the signal from few glycine molecules inside a single tube. While the SERS peaks are relatively low in intensity, it has previously been shown that the presence of carbon near the SERS-active metal can decrease the intensity of the SERS signal by factors of several hundred [20]. Although SERS studies have been done on carbon nanotubes, comparison of the Raman spectra of the CNTs and CNPs showed no changes suggesting a lack of SERS effects.
To give a more quantitative estimate of the SERS enhancement the enhancement factor (EF) was calculated according to [21].
E.F. = ISERSNRR/(IRRNSERS) (Eq. 1)
Where NRR and NSERS are the number of molecules probed by regular Raman spectroscopy and SERS, respectively; and IRR and ISERS are the corresponding intensities. To calculate the enhancement factor, it is critical to estimate the volumes probed by the two methods.
In the case of regular Raman spectroscopy, we assume that the volume probed is a cylinder of 2×5 μm (provided by a 50× objective in the confocal mode with an aperture of 50 μm), giving a volume of 15.7×10⁻¹⁵ L. Therefore, a glycine concentration of 2.7 M corresponds to ~ 2×10¹⁰ molecules in this volume, giving a Raman intensity of 30 cps.
In the case of SERS, the signal comes from at maximum one triangle inside the CNP. Because the diameter of the CNPs is approximately 300 nm, the largest size triangle that can enter the tubes is 300 nm edge length. Assuming that the electric field coming from the triangles does not extend to a distance higher than 35 nm [22], the analyzed volume can be considered as a triangular prism extending around the nanotriangle 35 nm in all directions. This has a volume of 8x10-19 L. Then, at a 1 mM or 10-3 M glycine concentration, ~ 480 molecules are probed in this volume, which produce a SERS intensity of 200.
From these parameters, we obtain an E.F.= (200×2.5×1010)/(30×480) ≈ 4×10⁸.
Due to the methods used, it is difficult to control the precise amount of particles that enter or attach to the nanotubes. As observed by SEM and TEM, the CNPs contain at most one triangular particle. The Bingel Rx CNTs tend to contain clusters of particles of which some are triangular. Naturally, a higher concentration of triangles would be more efficient in the signal enhancement. Future work would involve more complex methods to more specifically attach the triangular particles to the inner or outer surface of the nanotubes.
Conclusion
The functionalization of carbon nanotubes and nanopipes for use as surface-enhanced Raman spectroscopy probes has been achieved. SERS has been achieved using two types of nanotubes and attachment, to identical results. These have great versatility and flexibility for trace detection in biological applications. Also, the CNPs allow liquids to flow and interact inside and can be used for in situ studies. Chemical experiments can be conducted inside the tube, with the reaction products observed by SERS. Combining these SERS-active nanotubes with already existing nano-probing techniques could enable the study of cells with single-molecule sensitivity.
Methods and Materials
SERS-active gold nanotriangles were synthesized by the lemongrass method used in [23]. First, 5g of finely cut washed and dried lemongrass leaves were put in 20mL of boiling DI water for 5 min to create leaf extract. The gold was synthesized by mixing 10mL of a 1mM aqueous HAuCl4 solution with different amounts of the lemongrass extract at room temperature, and stirred overnight.
Glycine, an amino acid, was used as the SERS test sample as it is simple, has been studied previously in detail [18, 24, 25] and is a useful precursor to more complicated biological samples. Glycine was used as received from Sigma Co without further purification. The final concentration before use was 1 mM, with 10 mM NaCl and HCl to facilitate aggregation. This concentration was chosen because it is too low to be detected at all with standard Raman spectroscopy in the configuration used (a droplet on an Si wafer).
The CNPs were synthesized with a noncatalytic chemical vapor deposition (CVD) method using a commercial alumina membrane as a porous template (Whatman Anodisc®), nominal pore diameter: 300 nm±10%, thickness: 60 μm. Freestanding nanopipes were obtained after dissolution of the alumina template in a boiling 1M solution of sodium hydroxide. The diameter of the resulting nanopipes corresponds to the diameter of the pores in the original membrane, and length, after sonication, is generally 10 μm. After synthesis, the CNPs have a disordered wall structure [26].
Raman spectra were acquired using a Renishaw 1000/2000 Raman micro-spectrometer (1200 l/mm grating) in back-scattering geometry. The excitation source was a diode laser (785 nm), focused (50x objective) to a spot size of approximately 2 μm. The spectra were analyzed using Wire 2.0 software from Renishaw. Raman spectra were taken from multiple CNTs of each type and the results shown here are representative of all studied.
A Zeiss Supra 50VP was used to obtain scanning electron microscopy (SEM) images.
Acknowledgements
Thank you to D. Breger for operating the SEM, D. Mattia for synthesis and preparation of CNPs and operation of the TEM for Fig. 1a, and G. Korneva for performing the Bingel Rx on MWNT according to Ref. [16], and for synthesis of spherical gold golloid. The author also acknowledges Arkema, France for supplying multiwall nanotubes. TEM studies were performed at Penn Regional Nanotechnology Facility. A. Sabur was supported by an NDSEG Fellowship and a Dean's Fellowship. Raman Spectroscopy and Scanning Electron Microscopy was performed at the Centralized Materials Characterization Facility, Drexel University.
References
- Rossi MP, Ye H, Gogotsi Y, Babu S, Ndungu N, and Bradley J-C, Environmental Scanning Electron Microscopy Study of Water in Carbon Nanopipes. Nano Letters, 2004. 4: p. 989.
- Shah HJ, Fontecchio AK, Rossi MP, Mattia D, and Gogotsi Y, Imaging of liquid crystals confined in carbon nanopipes. Applied Physics Letters, 2006. 89: p. 043123-1 - 0431231-3.
- Kim BM, Qian S, and Bau HH, Filling Carbon Nanotubes with Particles. Nano Letters, 2005. 5(5): p. 873-878.
- Korneva G, Ye H, Gogotsi Y, Halverson D, Friedman G, Bradley J-C, and Kornev KG, Carbon Nanotubes Loaded with Magnetic Particles. Nano Letters, 2005. 5(5): p. 879-884.
- Kneipp K, Wang Y, Kneipp H, Perelman LT, Itzkan I, Dasari RR, and Feld MS, Single Molecule Detection using Surface-Enhanced Raman Scattering. Physical Review Letters, 1997. 78: p. 1667.
- Kneipp K, Kneipp H, Itzkan I, Dasari RR, and Feld MS, Surface-enhanced Raman scattering and biophysics. Journal of Physics: Condensed Matter, 2002. 14: p. R597-R624.
- Campion A, Ivanecky I, J. E., Child CM, and Foster M, On the mechanism of chemical enhancement in surface-enhanced Raman scattering. Journal of the Americal Chemical Society, 1995. 117: p. 11807-8.
- Otto A, Mrozek I, Grabhorn H, and Akemenn W, Surface-enhanced Raman scattering. Journal of Physics: Condensed Matter, 1992. 4: p. 1143-1212.
- Moskovits M, Surface-enhanced spectroscopy. Reviews of Modern Physics, 1985. 57: p. 783-826.
- Campion A and Kambhampati P, Surface-enhanced Raman scattering. Chemical Society Reviews, 1998. 27: p. 241-250.
- Mattia D, Korneva G, Sabur A, Friedman G, and Gogotsi Y, Multifunctional carbon nanotubes with nanoparticles embedded in their walls. Nanotechnology, 2007(18): p. 155305.
- Sabur A, Havel M, and Gogotsi Y, SERS intensity optimization by controlling the synthesis of faceted gold nanoparticles. Journal of Raman Spectroscopy, 2007. Accepted.
- Ayars EJ and Hallen HD, Electric Field Gradient Effects in Raman Spectroscopy. Physical Review Letters, 2000. 85(19): p. 4180-4183.
- Potlubotko AM, SERS phenomenon as a manifestation of quadrupole interaction of light with molecules. Physics Letters A, 1990. 146(1-2): p. 81-84.
- Haynes CL, McFarland AD, and Van Duyne RP, Surface-Enhanced Raman Spectroscopy. Analytical Chemistry, 2005: p. 339 A - 346 A.
- Colemen KS, Bailey SR, Fogden S, and Green MLH, Functionalization of Single-Walled Carbon Nanotubes via the Bingel Reaction. Journal of the Americal Chemical Society, 2003(125): p. 8722-8723.
- Antunes EF, Lobo AO, Corat EJ, Trava-Airoldi VJ, Martin AA, and Verissimo C, Comparative study of first- and second-order Raman spectra of MWCNT at visible and infrared laser excitation Carbon, 2006. 44(11): p. 2202-2211.
- Dou X, Jung YM, Yamamoto H, Doi S, and Ozaki Y, Near-Infrared Excited Surface-Enhanced Raman Scattering of Biological Molecules on Gold Colloid I: Effects of pH of the Solutions of Amino Acids and of Their Polymerization. Applied Spectroscopy, 1999. 53(2): p. 133-138.
- Kumar S, Rai A, Singh A, and Rai SB, Spectrochimica Acta Part A: Molecular and Biomolecular Spectroscopy, 2005. 61: p. 2741.
- Lyon SA and Worlock JM, Role of Electromagnetic Resonances in the Surface-Enhanced Raman Effect. Physical Review Letters, 1983. 51(7): p. 593-596.
- McFarland AD, Young MA, Dieringer JA, and Van Duyne RP, Wavelength-Scanned Surface-Enhanced Raman Excitation Spectroscopy. Journal of Physical Chemistry B, 2005. 109: p. 11279-11285.
- Kottmann JP, Martin OJF, Smith DR, and Schultz S, Non-regularly shaped plasmon resonant nanoparticle as localized light source for near-field microscopy. Journal of Microscopy, 2001. 202(1): p. 60-65.
- Rai A, Singh A, Ahmad A, and Sastry M, Role of Halide Ions and Temperature on the Morphology of Biologically Synthesized Gold Nanotriangles. Langmuir, 2006. 22: p. 736-741.
- Dou X, Jung YM, Cao Z-Q, and Ozaki Y, Surface-Enhanced Raman Scattering of Biological Molecules on Metal Colloid II: Effect of Aggregation of Gold Colloid and comparison of Effects of pH of Glycine Solutions between Gold and Silver Colloids. Applied Spectroscopy, 1999. 53(11): p. 1440-1447.
- Podstawka E, Part III: Surface-Enhanced Raman Scattering of Amino Acids and Their Homodipeptide Monolayers Deposited onto Colloidal Gold Surface. Applied Spectroscopy, 2005. 59(12): p. 1516-1526.
- Mattia D, Bau HH, and Gogotsi Y, Wetting of CVD Carbon Films by Polar and Nonpolar Liquids and Implications for Carbon Nanopipes. Langmuir, 2006. 22(4): p. 1789-1794.