TappingMode imaging has proved to be the most versatile mode of atomic force microscopy (AFM) in ambient conditions where the presence of a fluid layer (condensed water vapor and other contaminants) severely limits the applicability of both, contact mode and non-contact techniques. Overcoming the challenges posed by friction, adhesion, and other issues, TappingMode has provided a means of greatly extending AFM applications. Phase Imaging is an important extension of TappingMode imaging.
By mapping out the phase of the oscillating cantilever, phase imaging goes beyond simple topographical mapping. Being sensitive to variations in adhesion and viscoelasticity, phase imaging can provide information about sample composition and microphase separation.
First class high resolution performance is critical for taking full advantage of TappingMode phase imaging. With its stable, low-drift platform, ultralow noise closed loop scan control, and excellent force control the new Innova SPM (see Figure 1) is an ideal instrument for high resolution imaging of delicate samples. In addition, the Innova combines this outstanding core performance with generous data acquisition bandwidth and facile signal access, thus enabling a wide range of demanding research applications.
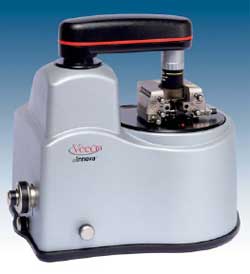
Figure 1. The Innova
Application Examples
Block Copolymers
Phase imaging can reveal microphase separations occurring in block copolymers. Obtaining this information with alternative techniques involves complications, such as chemical staining for TEM. With TappingMode phase imaging, AFM can provide the visualization of the microphase separation pattern directly from images obtained in ambient conditions of an untreated thin film. Figure 2 shows topography and phase images of a PS-b-PB-b-PS triblock copolymer (PS, polystyrene; PB, polybutadiene). Both channels clearly show the expected worm-like microphase separation pattern. The microphase domains exhibit a width of ~ 35nm.
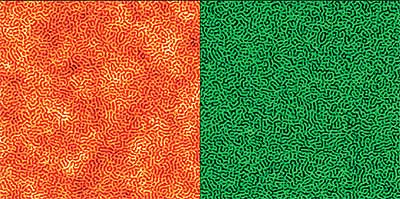
Figure 2. Topography (left) and phase image (right) of PS-b-PB-b-PS triblock copolymer. Sufficiently hard tapping conditions have ensured probe penetration into the subsurface layer, where a wormlike microphase separation pattern is present as can be seen clearly in both channels. Image size 2.0ìm. Closed loop active.
This can be seen most clearly in the 2-D Fourier Transform shown in Figure 3. Note that the intensity maximum is perfectly circular, as it should be given the overall isotropy with no preferred block orientation and no dependence of block width on azimuthal angle. These images were acquired using closedloop scan control, ensuring calibrated, undistorted measurements.
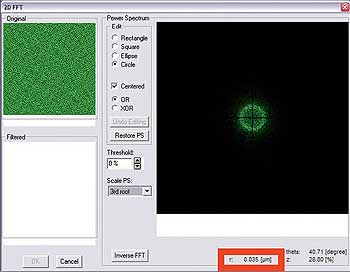
Figure 3. 2-D Fourier transform of the phase data shown in Figure 2. The ring-shaped intensity maximum indicates that the phase separation pattern is isotropic with a well defined repeat distance of r=35nm as indicated at the bottom of the dialog and as expected for this triblock copolymer.
Viscoelasticity and Material Modulus
For a phase image to reflect differences in viscoelasticity or modulus of a material, the AFM probe needs to penetrate the material. More precisely, the probe needs to penetrate sufficiently far such that the tipsample interactions are influenced by material properties from the layer of interest. In the case of a PS-b-PB-b- PS fi lm, an amorphous, PB-enriched top-layer is usually present. Thus, the combination of a soft cantilever (e.g., FESP, k ~ 2–5N/m) with very light tapping conditions would fail to uncover the microphase separation pattern.
Images such as those shown in Figure 2 are usually obtained with fairly hard tapping conditions, that is, fairly high ratios of free amplitude to amplitude setpoint. On Innova, probe tuning at moderate amplitude (input gain setting ~ 8 or 10) and signifi cant increase of the cantilever drive amplitude upon engaging will yield the desired result.
Mechanical Properties
As phase imaging is sensitive to local variations in mechanical properties, it can afford an efficient means for mapping out the distribution of components in composite samples. Figure 4 shows topography and phase images of a cross-sectioned multilayer polyethylene sample, composed of alternate high and low density layers. The topography image is dominated by the large scale, low frequency height undulation that has apparently resulted from cross-sectioning by cryo-microtoming. The phase image has a different appearance, clearly providing complementary information. It is dominated by an alternating set of stripes, obviously representing the sought after alternation in material properties and thus component layers. In addition, the phase image reveals topographic fine features that are much less apparent in the height image. In particular, small droplets can be discerned with well-defined phase contrast indicating distinct local mechanical properties. The formation and coalescence of small droplets on microtomed polyethylene samples indicate an ageing surface. Note that the droplets are not distributed randomly. Rather, some of them appear to form along lines, presumably small scratches imparted on the sample by the microtoming process.
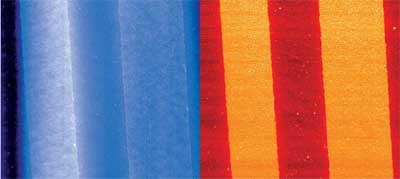
Figure 4. Topography (left) and phase image (right) of a cryo-microtomed multilayer polyethylene sample. While topography is dominated by large-scale undulations, phase provides a clean view of the layered structure. Additional fi ne structure shows the presence of small droplets. Image size 35ìm. Closed loop active.
Material Contrast and Topographic Information
In both, Figures 2 and 4, the phase image brings out the material contrast most clearly and separates it from information about large scale topographic information. However, in both cases, the material contrast seems to be also partly contained in the topographic image. The parts of the sample appearing with bright contrast in the phase image appear raised in the topographic image. This can be rationalized as a reflection of material stiffness. Under hard tapping conditions, the probe penetrates into the material. The regions appearing bright in the phase image are stiffer, leading to less probe penetration and thus a raised topography relative to the softer parts at high force. A more complete explanation of this effect has to include the nature of the feedback in tapping mode. Strong positive phase shifts in hard tapping conditions indicate significant upshifts in the resonance frequency of the cantilever – while drive frequency and amplitude setpoint chosen for feedback remain constant and were chosen at the resonance frequency of the free cantilever. In the regions with the most positive phase shift, the resonance frequency effectively shifts furthest away from the drive frequency.
Being furthest off-resonance, the cantilever is being driven less efficiently (while the amplitude setpoint remains unchanged), leading effectively to lighter tapping, which contributes to the appearance of a raised profile. Aside from compositional mapping and the visualization of microphase separations, phase imaging can aid in the detection of fine structures. In the case of the MLPE sample shown in Figure 4, interesting fine structure can be observed in higher resolution images of the layer boundaries when slightly lighter tapping conditions are employed. As can be seen in Figure 5, hair-like structures appear to extend from the boundary into the layer appearing with darker phase contrast. Closer inspection of Figure 5 reveals lamellar structures throughout the lower density (darker phase) component visible in the right half of the image and a gradual loss of alignment with increasing distance from the interface.
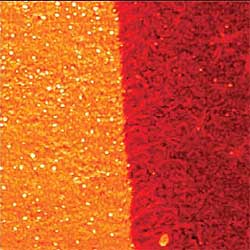
Figure 5. Phase image of a cryo-microtomed multilayer polyethylene sample. Hair-like fine structure can be seen near the layer-interface. Image size 5ìm. Closed loop active.
Figure 6 shows AFM images of an oriented film of isotactic polypropylene, also known as the microporous membrane Celgard. Both, topography and phase clearly show the pattern of oriented fibrillar structures that is characteristic of this sample. With the overall height scale (~ 200nm) dominated by large variations, finer structures are not evident in the topography data. In contrast, the phase image exhibits very clear and well-defi ned additional features. Fine lamellar structures (only ~ 20nm wide) are seen to be present in between the rows of fibrils. The lamellar structures are seen to be oriented perpendicular to the larger fibrillar structures. As the phase signal is sensitive to deviations of the oscillation amplitude from the amplitude setpoint, it can serve as an edge detection technique and thus highlights such fine structures that are easily overlooked in the topography channel. The accurate imaging of fine structures on this delicate sample benefits greatly from Innova’s combination of excellent force control and low noise closed-loop scan control.
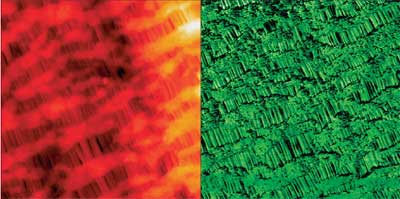
Figure 6. Topography (left) and phase image (right) of Celgard. While oriented fibrillar structures are evident in topography, the phase image additionally reveals lamellar fine structure. Image size 2.5ìm. Closed loop active.
The appearance of fine structure in phase images complements the sensitivity to material properties. By identifying components in composite samples, the appearance of fine structure in phase images aids in compositional imaging. Even higher resolution phase images can reveal length scales associated with the self-assembly of individual molecules in monolayer films and their relationship to the substrate. Figure 7 shows topography and phase images of a self-assembled monolayer of C60H122 alkane molecules on a substrate of highly-oriented pyrolytic graphite (HOPG).
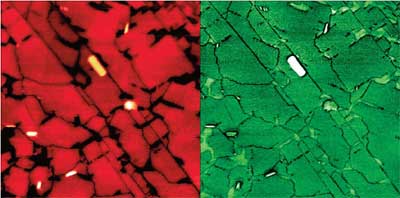
Figure 7. Topography (left) and phase image (right) of a C60H122 monolayer self-assembled on graphite. Both images clearly show self-assembled domains, each of which is composed of parallel lines. Image size 1.5ìm. Closed loop active.
Both images clearly show the presence of patches (domains) separated by sharp (mostly straight) borders. Closer inspection reveals a pattern of straight lines within each domain. This lamellar pattern is much more obvious in the higher resolution phase image shown in Figure 8. The lamellae are seen to have a well-defined spacing as well as preferred directions. This is confirmed in Figure 9, which shows the Fourier Transform of the phase image shown in Figure 7. The Fourier Transform shows very clearly the hexagonal symmetry of the self-assembly pattern that reflects the hexagonal symmetry of the underlying graphite substrate. When forming self-assembled monolayers, C60H122 alkane retains a fixed relationship to the high symmetry axes of graphite.
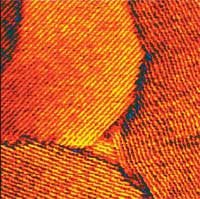
Figure 8. Phase image of a C60H122 monolayer selfassembled on graphite clearly showing lamellar fine structure associated with the self-assembly. Image size 390nm. Closed loop active.
The special relationship of the adsorbate structure with the graphite substrate is consistent with the assumption, that the layer probed here is actually the molecular layer that is in direct contact with the substrate. The question arises because the preparation of the C60H122 alkane sample cannot be assumed to result in a single molecular layer. Indeed, judicious choice and excellent control of tapping forces is required to reveal the structures shown here. The probe has to penetrate through partially disordered, soft adsorbate multilayers without destroying that “first” molecular layer that is in direct contact with the substrate and is thereby subject to additional stabilization.
As indicated in Figure 9, the spatial periodicity is seen to be about 7.5nm. C60H122 alkane is known to self-assemble on graphite such that each molecule assumes an extended all-trans conformation with its backbone parallel to the substrate and perpendicular to the lamella axis. Therefore, the lamella width equals the length of a single C60H122 alkane molecule, which is about 7.5nm.
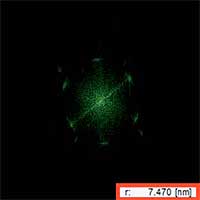
Figure 9. 2-D Fourier Transform of the phase image shown in Figure 7. The hexagonal symmetry is clearly visible. As shown near the bottom, the periodicity is measured to be r=.5nm.
The interrogation of self-assembly in monolayers on fl at substrates depends critically on good force control for nondestructive imaging, in conjunction with high stability and low stage drift to enable the required high resolution performance. Obviously, the analysis presented above also requires correct scanner calibration. Closed-loop scan control can ensure correct calibration but is often associated with excessive noise levels. Not so on Innova. In fact, all images presented in this application note (including the 390nm image shown in Figure 8) were acquired on Innova with closed-loop control active, thus ensuring accurate measurements.
Summary
With TappingMode phase imaging, the Innova system can efficiently and nondestructively map variations in sample properties at the highest resolution. As TappingMode is often the preferred imaging mode for delicate samples, phase imaging can complement other modes such as force modulation and lateral force microscopy, often with superior image detail. Phase imaging applications include the characterization of composite materials, mapping of variations in adhesion and viscoelasticity, and identification of surface contamination. Highest resolution phase images open the door to studies of molecular selfassembly. The combination of excellent high resolution performance and TappingMode phase imaging makes Innova a powerful tool for the study of material properties at the nanometer scale.
.jpg)
This information has been sourced, reviewed and adapted from materials provided by Bruker Nano Surfaces.
For more information on this source, please visit Bruker Nano Surfaces.