Lake Shore Cryotronics, Inc. is a privately held corporation which has been an international leader in the development of innovative measurement and control technologies since 1968. Lake Shore's philosophy has been to continue to reinvest in itself with a research and development budget that is 100 percent above the national average for instrumentation companies.
Introduction
Microwave measurements on a TTP4 probe station with semirigid coaxial arms with SMA connectors (K-085-K) were performed from 30 kHz to 6 GHz. The probe tips were BeCu (ZN50R-25-BeCu). All measurements reported here were at room temperature.
Measurement Procedure and Instrumentation
The transmission (S12) and reflection (S11) coefficients of a TTP4 probe station with semirigid arms were measured. The measurements were performed using a Hewlett-Packard HP8753ES S-parameter Network Analyzer. The frequency range of the measurements was 30 kHz to 6 GHz.
This network analyzer has APC 7 mm connectors. A custom cable was manufactured for the measurements. The cable was 3 ft of Trompeter SEMFLEX 50 Ω coax with an APC 7 mm connector on one end and SMA connectors on the other end. Passive 50 Ω strip line was used for the measurements. Figure 1 is a picture of the circuit. To measure the frequency response of the test circuit, two measurements were performed. The first was with a 25 cm length of semirigid cable soldered to the strip line. These soldered connections also had a signal ground directly at the sample. In the data plots, these are referred to as "soldered connection".
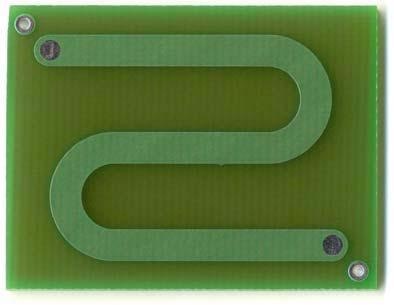
Figure 1. 50 Ω strip line circuit
PC Board Strip Line Semirigid Cable BeCu Probes
The measurements of the sample consisted of an 8 cm length of 50 Ω strip line on a sample of printed circuit board. The line was printed in an s-pattern to fit the available space, and simply served as a sample to test the measurement characteristics of the ZN50 probes and the probe station arms. The plots of S21 and S22 are shown in figures 2 and 3. The large spike in S21 at 400 MHz is related to the break in the ground from the probe to the sample.
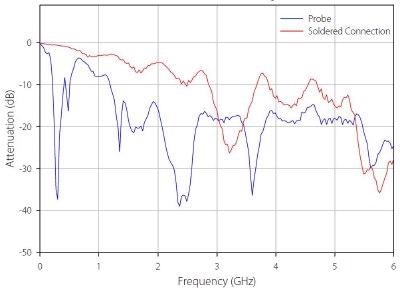
Figure2. S21 (forward scattering parameter) vs. Frequency, PC board strip line
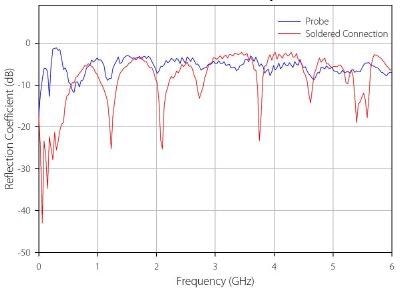
Figure 3. S11 vs. Frequency, PC board strip line
Figure 4 shows similar measurements in a TTP6 probe station. We see that the attenuation peak has moved up to about 800 MHz.
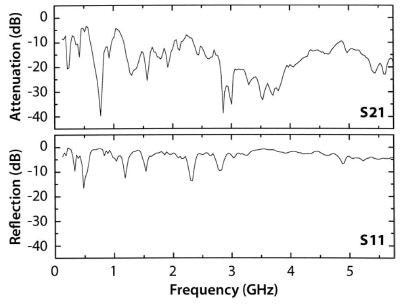
Figure 4 TTP6 Attenuation and Reflection

This information has been sourced, reviewed and adapted from materials provided by Lake Shore Cryotronics.
For more information on this source, please visit Lake Shore Cryotronics.