The flexible set-up and modular design of the WITec alpha 300S enables scanning near-field optical microscopy (SNOM) as well as diffraction-limited Raman imaging to be combined into a single instrument. Based on Abbe's theory of diffraction and Rayleigh's definition of the diffraction limit, a spatial resolution of about 200nm can be obtained with confocal Raman imaging.
The resolution is restricted in SNOM only by the aperture size of the cantilever SNOM probe which is in the range of 60-90nm. Integration of SNOM and Raman for acquiring Raman images via a SNOM tip is suited for very strong Raman scatterers or surface enhanced Raman spectroscopy (SERS) experiments because of the low light levels.
Tip-Enhanced Raman Spectroscopy
Tip enhanced Raman spectroscopy (TERS) can be applied to obtain a lateral resolution far below the diffraction limit. In a typical TERS experiment, a gold or silvercoated AFM tip is utilized as a nanostructure to create signal enhancement on the surface of a sample after focusing the excitation laser on the apex of a tip (Figure 1) with the tip brought very close to the surface.
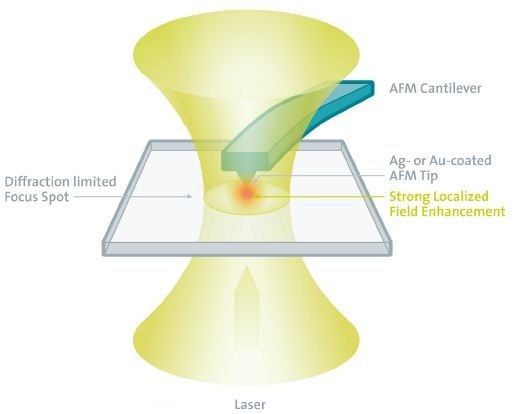
Figure 1. Working principle of TERS.
The tip radius is in the range of 10-20nm and defines the lateral resolution of an AFM measurement. The lateral resolution is based on the hot-spot size in a TERS experiment and one can expect resolution in the 20-50nm range for Raman spectroscopy and imaging measurements.
The excitation laser from either above, below or the side is used to illuminate the TERS tip apex. The alpha300 SR SNOM Confocal Raman combination offers the beam path geometry for all of these excitation approaches as shown in Figure 2.
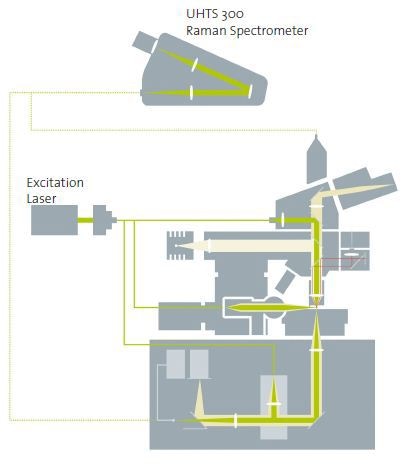
Figure 2. WITec alpha300 TERS configurations: Excitation from the side, above or below; detection from the side, above or below.
In this experiment, a carbon nanowire was studied with an alpha300 SR so as to show the TERS capabilities of the system. The shape and dimension of the nanowire as measured in AFM-AC mode is shown in Figure 3.
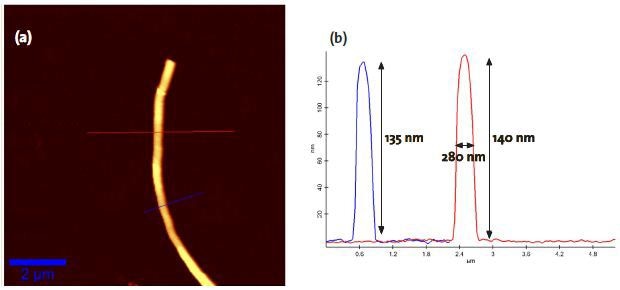
Figure 3. a) AFM topography image of the carbon nanowire used for the TERS experiments in this study. b) Data of the cross sections at the indicated lines.
For TERS measurements, the tip was made to contact the nanowire from above the equipment. The Raman signal was obtained with a cover glass corrected 60x, 0.8 NA objective.
Results and Discussion
In the first experiment, the impact of general tip-induced effects was studied so as to appropriately qualify the results obtained with the specified TERS geometry. A Si/Al-coated AFM Tip was brought close to the nanowire with no major improvement of the Raman signal expected.
Figure 4 illustrates the two spectra:
- The red spectrum the intensity with the tip retracted
- The blue spectrum depicts the intensity of the Raman spectrum with the tip in close proximity, showing an improvement by a factor of two.
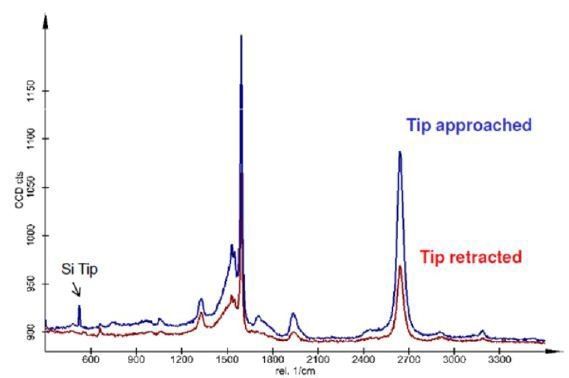
Figure 4. Pseudo-TERS effect. Raman Spectra acquired on the carbon nanowire with a Si/Al-coated AFM tip.
In a typical scenario, aluminum does not trigger enhancement, hence it is possible that this effect is due to mirror-like reflections, also termed as pseudo-TERS.
In the next experiment, a silver-coated Si AFM tip was brought into close proximity with the nanowire, while the spectral intensity was being measured. The result of this experiment is shown in Figure 5 with the red spectrum showing the intensity with the approached tip and the blue spectrum displaying the spectral intensity with the retracted tip. It is possible to observe an enhancement of up to a factor of 12, which shows clearly that the tip enhancement took place while it was in close proximity with the nanowire.
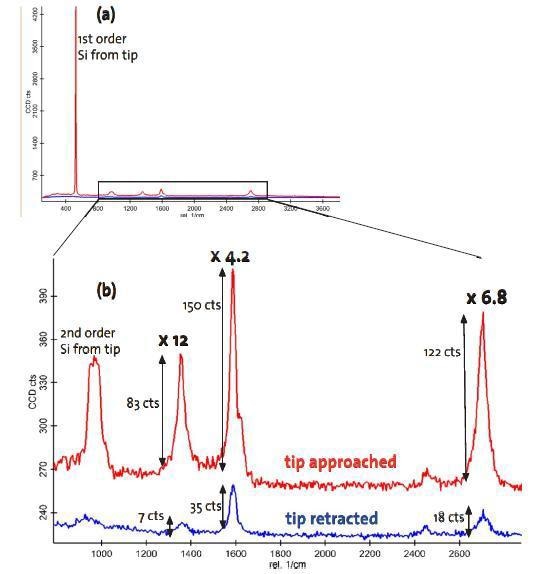
Figure 5. a) Tip-enhanced Raman spectroscopy on the nanowire. Blue spectrum: tip retracted, red spectrum: tip approached; b) Zoom-in of the fingerprint region indicating an enhancement of up to a factor of 12.
Tip-enhanced Raman Imaging of Carbon Nanotubes
Weber-Biagoni et al (2011) carried out research on Hyperspectral Nanoscale Imaging on Dielectric Substrates with Coaxial Optical Antenna Scan Probes and succeeded in imaging carbon nanotubes with a lateral resolution of ca.20nm.
Conclusion
The results presented in this study clearly show that the alpha300 SR is a TERS-ready system that can successfully perform several tip-enhanced Raman spectroscopy experiments. The possibilities range from obtaining single Raman spectra in TERS-mode to nano-scale Raman imaging.
These results also establish that this method is ideal for chemical imaging at a resolution beyond the diffraction limit. However, various challenges must be taken into consideration to establish this method as a standard and routine analysis technique. It is important to clearly differentiate pseudo-TERS effects from true TERS enhancements and special care must be taken by the experimenter to reduce or prevent such unwanted effects.
In quite a number of cases, TERS experiments are performed using gold-nanowires. In this setup, the shear force detection principle is used to achieve the distance control, rendering this setup as even more challenging.The results presented in this article have all been obtained with functionalized AFM-TERS probes using the beam-deflection principle for distance control.
To summarize, it is essential to conduct additional research in the field of TERS imaging and tip- functionalization so as to establish the technique as a standard and routine experimental technique for relevant fields of application. The TERS-capabilities of the WITec alpha300 microscope series easily facilitate such experiments.

This information has been sourced, reviewed and adapted from materials provided by WITec GmbH.
For more information on this source, please visit WITec GmbH.