Strict regulatory and energy conservation requirements imposed on the construction and design of modern buildings in recent years have provided challenges for the glass industry. Thin material-coated float glass is a resulting technological advancement, produced to minimize emissivity. Maintaining the maximum of natural light, this reduces the amount of energy required to cool and heat. This development led to the evolution of burgeoning glass coating technology, enabling a cost-effective and large-scale production of the product.
Low emissivity glass often consists of a thin silver layer sandwiched between dielectric materials and other metals. SIMS enables the determination of the composition and failure mechanisms of this material, using its extreme sensitivity. When used with a FIB-SEM instrument, in a typical FIB-SIMS configuration, Hiden EQS (Figure 1) can perform this analysis within an hour.
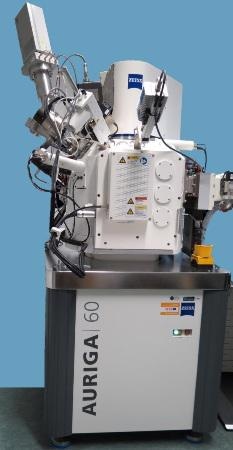
Figure 1. Hiden EQS on a Zeiss Auriga 60 FIB-SEM instrument
Analysis Conditions
The following are the analysis conditions of the Hiden EQS FIB-SIMS depth profile of low emissivity float glass (low e-glass):
- Analysis conditions - 5keV Ga @ 3nA, spot size ~30nm into an 85μm raster. No charge neutralization available
- Analysis time - Less than one hour
- Sample preparation - Capped with sputtered gold to minimize charging as a result of insulating substrate. Mounted on standard SEM sample stub with the help of silver dag for conductive path to ground
- Sample preparation time - Less than one hour
Experimental Results
As shown in Figure 2, starting after the Gold capped surface, the first layer of Zinc Tin Oxide (ZTO) was found to be thin, yet clearly visible and stable. This is due to a sacrificial layer provided by the Gold cap, consumed in the SIMS pre-equilibrium region at the beginning of the analysis. The ZTO layer was immediately followed by the Silicon Nitride (SiN) and the Aluminum Nitride (AlN) layers.
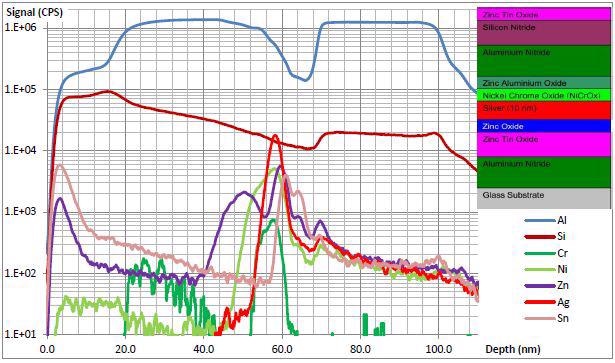
Figure 2. Full depth profile 85 x 85 x 0.1 μm
As the tail from the Zinc/Tin oxide layer extends into the Nitride layers at decreasing levels, the interface of the Silicon Nitride and the Aluminum Nitride layers can be seen.
The 10 nm Silver layer with its protective layers of Zinc Aluminum Oxide and Nickel Chrome Oxide at the front, and Zinc Oxide and ZTO at the rear are visible again, with the Silver exhibiting 10 nm design thickness. Figure 3 details the depth profile, the protective layers that have Zinc present follow the expected profile depending on the layer design.
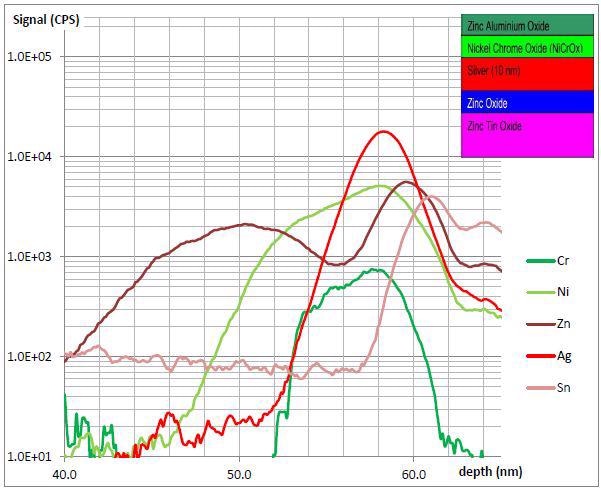
Figure 3. Detail of Silver layer over 25 nm depth
The design thickness of the Chrome and Nickel layer was only 1 nm, it was found that this layer had mixed with Silver layer during analysis. The glass substrate was capped using the aluminum nitride layer.
Surface charging was observed during the start of this final interface, resulting in the gradual fall of all of the signals with increasing depth. The addition of a charge neutralization facility allows for analysis of bulk insulating materials.
Conclusion
FIB-SIMS is an ideal choice for studying the nano-scale layers and low concentration features in this investigation. The Hiden EQS can be used to highlight fine details of the subject under study, combined with a FIB-SEM instrument, the Hiden EQS ensures good sensitivity, depth resolution and excellent results. The integration of FIB or FIB-SEM instruments as an add-on provide depth profile capability, equivalent to a standalone SIMS employing a gas ion source.

This information has been sourced, reviewed and adapted from materials provided by Hiden Analytical.
For more information on this source, please visit Hiden Analytical.