The microspectrophotometer is a powerful analytical instrument that couples an optical microscope and a UV-visible-NIR spectrophotometer. This integration allows molecular reflectance, absorbance, and emission spectra to be acquired from microscopic regions within larger specimens or microscopic sample volumes, with spectra spanning from the deep ultraviolet through to the near-infrared.
A microspectrophotometer can quantify reflectance, absorbance, transmittance, and fluorescence or phosphorescence emission from areas as small as a square micron, depending on its specific configuration.
This platform can also function as a microscope colorimeter or as a thin-film thickness meter via interference analysis when used in conjunction with dedicated computational algorithms.
There is a threefold analytical rationale for microspectrophotometry.
Firstly, it is possible to obtain spectra from sample areas on the order of one micron, far below conventional benchtop spectrophotometers’ sampling footprint.
Secondly, the technique needs only minimal liquid or solid sample mass and is generally minimally invasive or entirely non-destructive.
Thirdly, spectrophotometric measurement is intrinsically quantitative, meaning that it offers a more objective, reproducible basis for color and material comparison compared to visual assessment.
Its correction for illumination variance, broad spectral range, and wavelength-resolved intensity data all contribute to reducing the subjectivity characteristic of human color perception.
The characterization of microscopic specimens was historically dependent on microchemical assays followed by microscopic or visual inspection.
These approaches saw widespread use prior to the development of microspectroscopic instrumentation, but they require comparatively large sample quantities, are generally consumptive, and are limited by the human observer’s consistency and acuity.
UV-visible-NIR microspectroscopy bypasses these limitations, offering a more rapid approach that yields quantitative, linearly comparable data, as opposed to qualitative color impressions, and extends detection beyond the visible range accessible to the human eye.
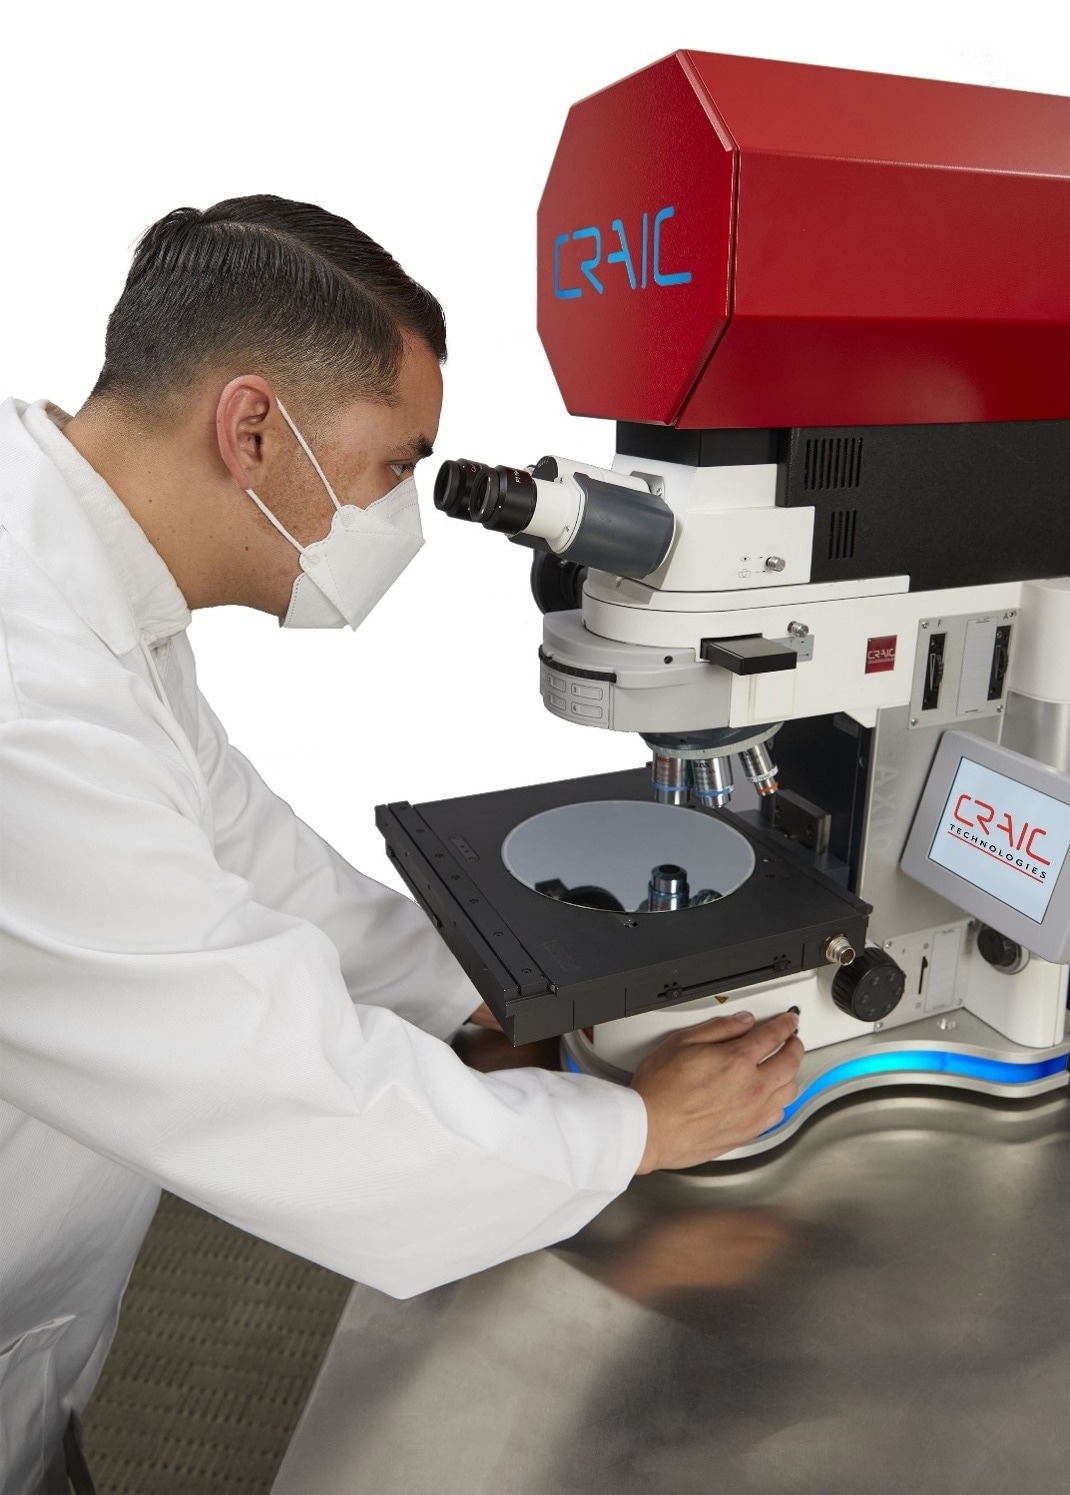
Figure 1. A microscope is integrated with a spectrophotometer so that UV-Visible-NIR range spectra can be taken from microscopic samples. Image Credit: CRAIC Technologies
A microspectrophotometer integrates an optical microscope, an image-forming subsystem designed to locate and define the sampling region, and a spectrophotometer suitable for wavelength-resolved detection (Figure 1).
The microscope component enables visual and optical inspection by enlarging the image of sub-millimeter features, while the spectrophotometer measures the intensity of electromagnetic radiation as a function of wavelength across the ultraviolet, visible, and near-infrared regions.
The integration of these components allows reflectance, absorbance, and emission spectra to be acquired from sampling areas on the micron scale.
Purpose-built optical components are required to achieve broadband performance while preserving both spectral quality and imaging fidelity. The optical materials and illumination sources used in their construction mean that traditional optical microscopes are restricted to a portion of the visible spectrum.
In contrast, instruments designed for UV-visible-NIR microspectroscopy incorporate specially coated or customized reflective or refractive optics and broadband illumination sources optimized for transmission from the deep UV through the NIR.
The spectrophotometer subsystem must also be engineered for microscale measurement. It is essential that the system offers high dynamic range, because users regularly alternate between reflectance or transmission measurements and fluorescence measurements at a single sample location to extract complementary spectral information. This requires high detector sensitivity with no compromise in spectral resolution.
Microspectrophotometers are single-beam instruments, meaning that it is necessary to acquire reference (baseline) spectra prior to sample measurement. Optical and thermal stability are, therefore, critical performance parameters.
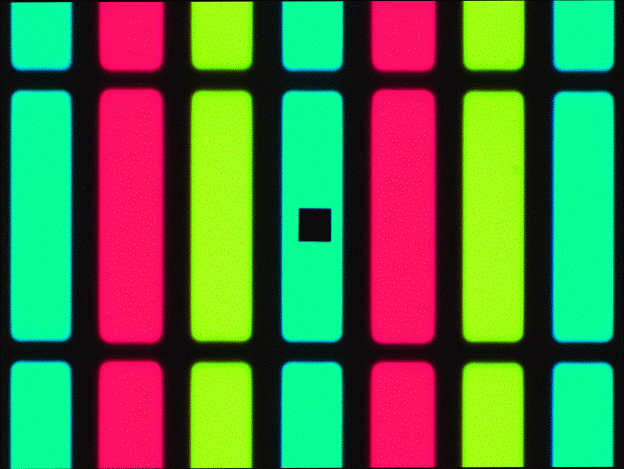
Figure 2. When imaging a sample with a microspectrophotometer, the black square in the center of the image is actually the entrance aperture of the spectrophotometer. The user simply moves the sample stage so the black square is superimposed over the area to be measured. Image Credit: CRAIC Technologies
The most consequential engineering challenge is arguably the coupling of the spectrophotometer to the microscope.
It is important that the interface directs the UV-Visible-NIR electromagnetic energy collected by the microscope objective into the spectrophotometer while ensuring that the operator can visualize the measurement region and its surrounding field of view.
Situating the spectrophotometer's entrance aperture at the same focal plane as the sample image is key to achieving this. This allows the sample stage to be translated until the target region falls within the projected aperture (Figure 2); the aperture boundary is denoted by the dark square.
The aperture and sample are simultaneously imaged, enabling real-time alignment. This ensures the rapid, reproducible positioning of the measurement area.
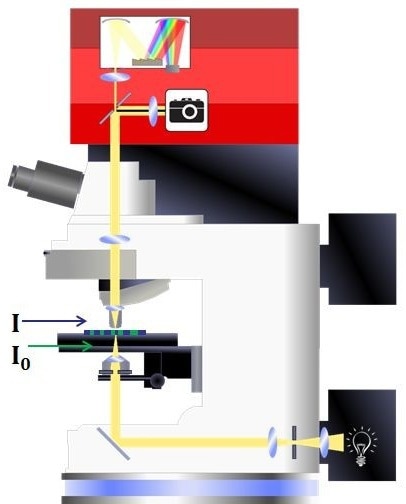
Figure 3. Schematic showing the optical path for a microspectrophotometer configured for absorbance microspectroscopy. Image Credit: CRAIC Technologies
The microscope’s objective focuses incident radiation onto the sample (Figure 3). Photons generate reflected, transmitted, or emitted radiation as they interact with the sample, and this radiation is collected by the same or a complementary objective before being focused onto the spectrophotometer’s entrance aperture.
A digital camera images most of the field to provide navigation and aperture alignment, while radiation passing through the aperture is directed into the spectrophotometer to enable spectral acquisition.
Illumination geometry is selected in line with the measurement objective. Incident (epi-illumination) white light facilitates reflectance microspectroscopy across the deep UV to near-IR range. This can also be configured to accommodate fluorescence or photoluminescence excitation with arc lights or lasers.
Directing white light through the sample via the microscope condenser enables transmission microspectroscopy.
Microspectroscopy Applications
Microspectrophotometers were initially developed in the 1940s, and their range of applications has expanded significantly since then. The technique is now widely used across industrial, academic, and forensic laboratories for failure analysis, quality control, and fundamental research.
Forensic Science
Microspectrophotometry has underpinned the analysis of trace evidence since the early 1980s, most notably paint chips and textile fibers.
This evidence is generally microscopic in scale and must be preserved to enable courtroom presentation or additional testing, making non-destructive analysis essential.
Fiber examination is dependent on the collection of UV-visible-NIR absorbance and fluorescence spectra from individual filaments.
Paint evidence is typically cross-sectioned, with each layer’s absorbance spectrum measured to enable high-discrimination comparisons between questioned and known samples.
Questioned-document examination sees inks and substrates characterized via reflectance microspectroscopy supplemented by fluorescence spectroscopy. This forensic application relies on this approach because the majority of papers are too opaque for transmission measurement.
The capacity to resolve micro-printing, individual pen strokes, and security features makes microspectroscopy especially valuable in this context.
Thin-Film Metrology
The flat-panel display and semiconductor industries use microspectrophotometers to determine the thickness of thin films deposited during integrated-circuit fabrication.
Either a reflectance or transmission spectrum is acquired depending on substrate transparency. This is collected from a small sampling area, and the resulting interference pattern–similar to the color fringes observed in an oil film on water–is analyzed with dedicated software designed to calculate film thickness.
This capability has extended beyond semiconductor quality control and is now used in the development and manufacture of flat-panel displays, optical coatings, and other layered devices.
Energy and Geosciences
Microspectrophotometers are used in petroleum and coal geochemistry to evaluate source rock’s thermal maturity, and, by extension, its energy content. This is achieved by measuring the reflectance of vitrinite and other macerals in polished sample sections.
Reflectance values are then correlated with established maturation scales to characterize the potential for hydrocarbon generation.
Materials Science
A single instrument can measure transmission, reflectance, and emission spectra from the same sample region, meaning that microspectrophotometers can support a wide range of materials characterization.
Notable materials science applications include the optical characterization of silver and gold nanoparticles, where measuring the effects of surface plasmon resonance is central to understanding size- and shape-dependent optical properties.
Other applications in this field include the characterization of diamond-like carbon films, polymeric and other thin-film materials, for both thickness determination and electronic-structure analysis via reflectance and absorbance spectroscopy.
Biotechnology and Life Sciences
Microspectrophotometers’ flexibility in probing arbitrarily small measurement points across a device means that they see regular use in biological research in the development and quality control of microfluidic devices.
In vision science, this technique is used to compare spectral response before and after light exposure, allowing photochemical changes in ocular tissue to be monitored.
Other applications include the characterization of structural coloration in biological materials, for example, individual feather barbules’ optical properties, and mapping the pigment and photonic structure of scales on butterfly wings. This work has informed both biological understanding and fundamental optics in these areas.
Emerging and Other Applications
Computational tools have advanced, and a number of newer application areas have already adopted UV-visible-NIR microspectroscopy as an instrumentation method.
Pharmaceutical Solid-State Characterization
Microspectrophotometry is seeing more widespread use in distinguishing polymorphic forms, assessing crystallinity, and mapping the spatial distribution of active pharmaceutical ingredients within microparticles or tablets as part of formulation development and studies into dissolution behavior.
Cultural Heritage and Art Conservation
Non-destructive reflectance and fluorescence microspectroscopy can be applied to dyes, pigments, and varnishes in manuscripts, paintings, and textiles, allowing the detection of restoration or overpainting, identification of historical materials, and authentication studies without the need to sample the object.
Two-Dimensional and Quantum Materials
Micro-reflectance and micro-transmission spectroscopy are used to characterize exfoliated or grown two-dimensional materials, such as graphene and transition-metal dichalcogenides.
The use of optical contrast and interference-based methods in this field allows the rapid estimation of layer number and identification of localized strain or defects. Microspectrophotometers can also collect circular dichroism spectra to further characterize the materials being analyzed.
Gemology
Microspectrophotometers help distinguish synthetic or treated gemstones from natural ones by resolving diagnostic absorption features linked to trace-element chromophores, typically from areas that are too small for traditional bench spectrophotometry.
Battery and Energy Storage Materials
Microscale absorbance and reflectance measurements support the study of thin coatings and electrode materials used in battery research, including the in situ monitoring of optical changes associated with degradation or phase transitions.
Single-Cell and Live-Cell Spectroscopy
Developments in low-light detection have extended microspectrophotometry to single-cell measurements, including time-resolved spectral changes during cellular processes and the label-free monitoring of intracellular chromophores.
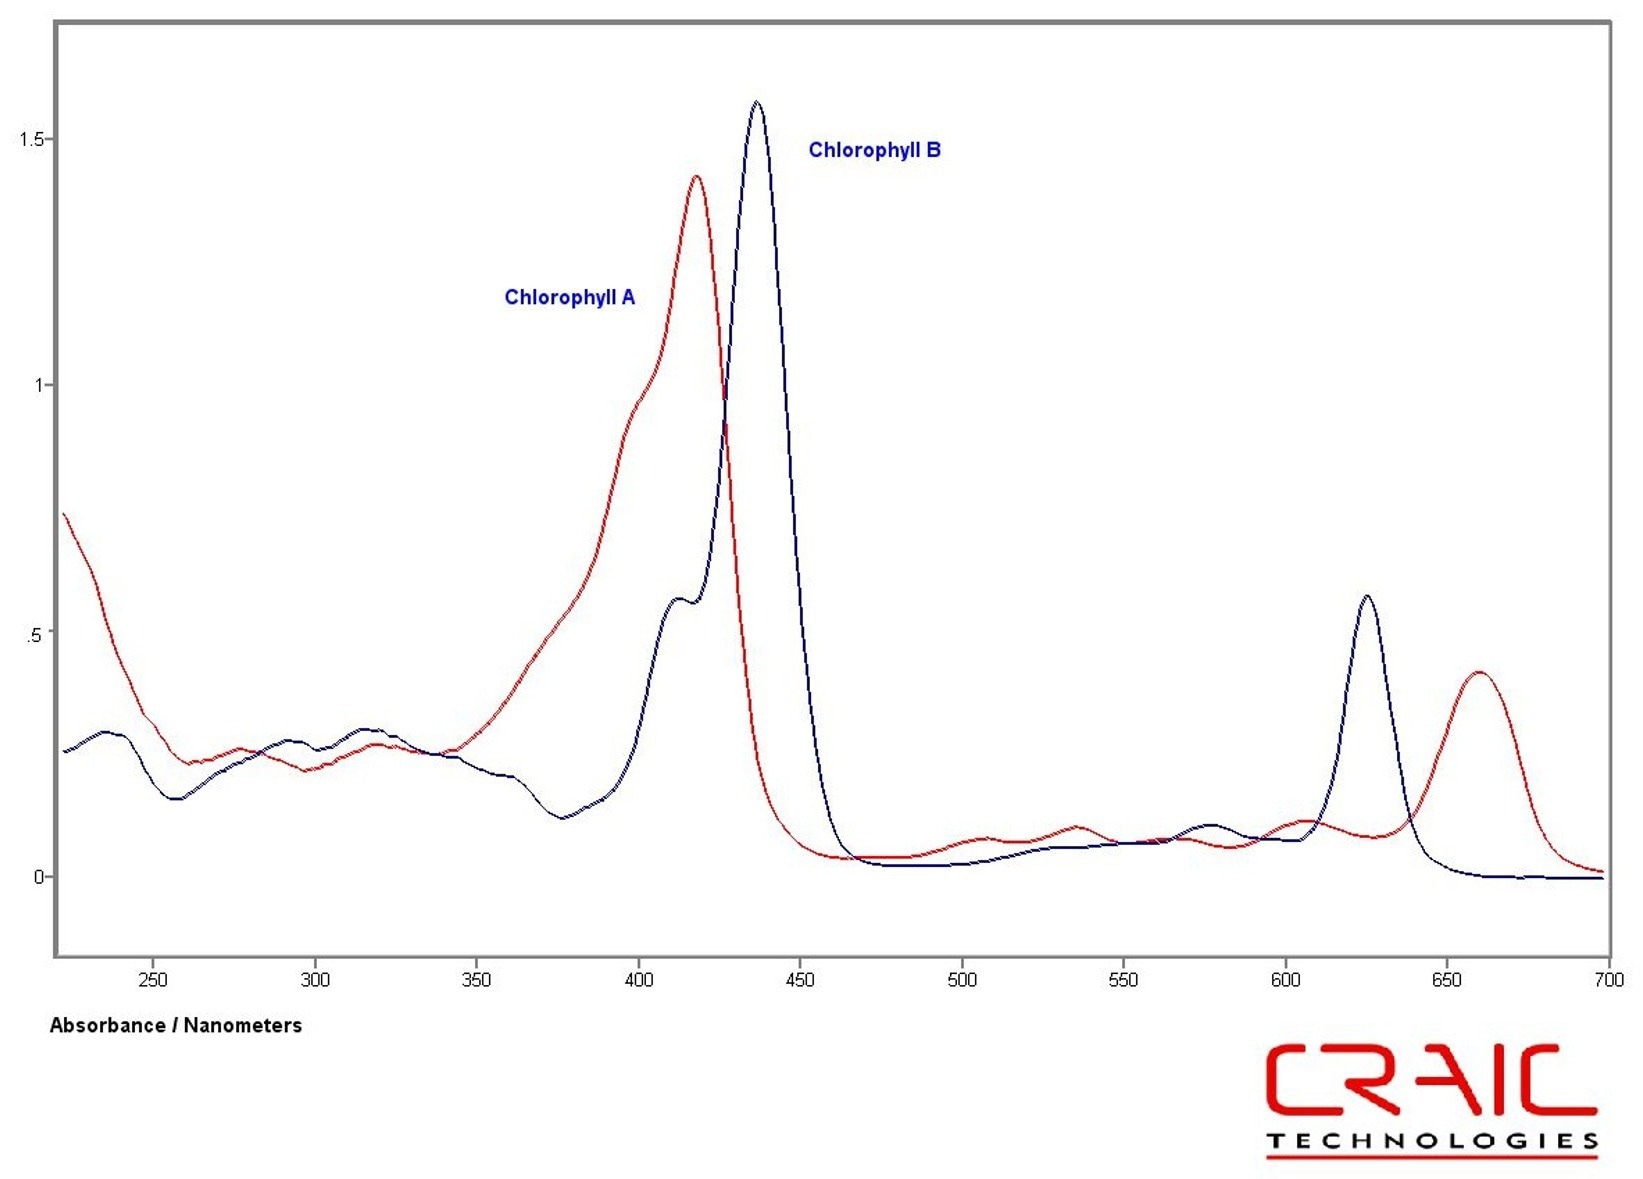
Figure 4. UV-Visible absorbance spectra of chlorophyll. Image Credit: CRAIC Technologies
Conclusion
The microspectrophotometer’s powerful combination of optical microscopy’s spatial resolution and UV-visible-NIR spectrophotometry’s quantitative rigor is key to its ability to collect reflectance, absorbance, and emission measurements from microscopic sample regions.
This hybrid capability has seen the technique become widely recognized across forensic science, optical thin-film and semiconductor metrology, materials science, energy geochemistry, and biotechnology.
Continually developing instrumentation is also opening new application areas, ranging from pharmaceutical applications and cultural heritage analysis to single-cell biology and two-dimensional materials.
The UV-visible-NIR microspectrophotometer is a versatile, largely non-destructive analytical platform that remains a key tool for extending spectroscopic analysis into the micro-world.

This information has been sourced, reviewed, and adapted from materials provided by CRAIC Technologies.
For more information on this source, please visit CRAIC Technologies.