APEX™, the industry-leading software from EDAX, is made for the collection and analysis of energy dispersive x-ray spectroscopy (EDS/EDX) data, as well as compositional material characterization. APEX’s user-friendly interface, concurrent review mode analysis, and real-time graphical presentation ensure superior quality, accurate findings, and increased productivity.
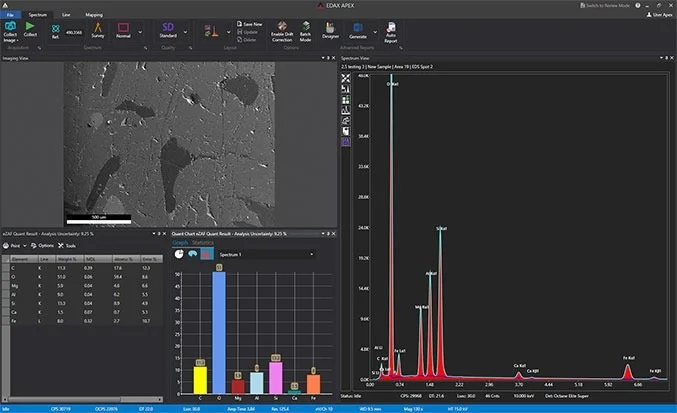
Image Credit: Gatan
Ease of use
- Automated standard processes allow for quick and simple analysis
- Login based on profile ensures that everyone, from individual users to administrators, has the appropriate amount of access
- Intuitive operation for beginner and expert users
- Acquire and report data with a single mouse click
Customization
- Users can choose a color scheme to match the scanning electron microscope (SEM) interface or their personal tastes
- Organize and resize data windows according to user needs
- Configuration options for the display data presentation depending on user preferences
Features
Simultaneous Live and Review mode
Increase the efficiency of an experiment by collecting a linescan, spectrum, or map as users evaluate data and generate reports.
Real-time results
- Using Element ID, users can instantly identify and display elements
- Edit items dynamically for the most exact and efficient examination
Smart Quant
Concurrently carry out quantitative analysis while collecting spectral data without causing any delays in the acquisition.
Quantitative compositional information can be obtained through ZAF-corrected spectrum analysis.
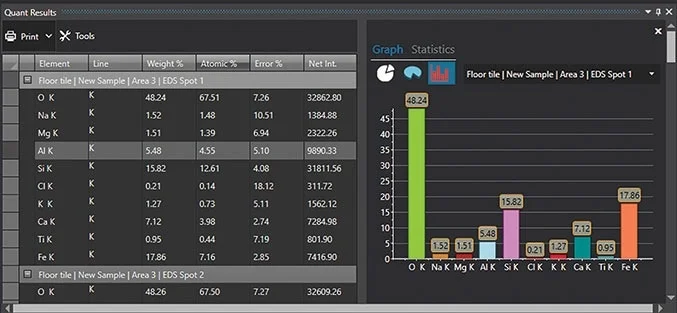
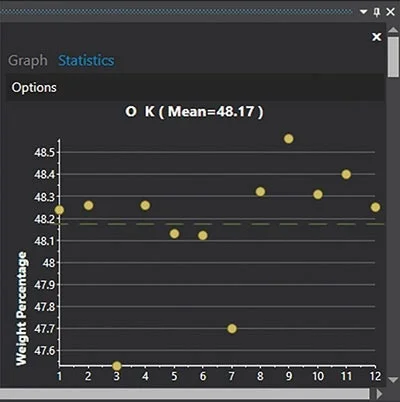
Graphical representation and statistical analysis of quantification results. Image Credit: Gatan
Full standards quant
- The ability to search, choose, and merge standards with ease
- SmartStandards mode for intelligent standard selection for accurate quantification outcomes
Multipoint analysis
- Use survey mode to complete point sampling swiftly
- To improve data collection efficiency, mark and inspect several spots on a sample
- To automate data collection and analysis, multipoint scan lists can be saved and retrieved
Data management and reporting
- Project tree storage for smooth management of all data
- Single click saving of windows as *.bmp, *.jpg, *.png, or *.tif images
- Project exports to *.hdf file format
Advanced reporting
- Effectively combines many templates to display results
- Modify presentation templates for images, logos, quantification results, text, spectra, and sample information using Report Designer
- Data from different places or samples in the same report can be readily compared
- Create reports directly from APEX Live mode to shorten the time to results.
- Reports can be generated automatically and quickly following the collection of data
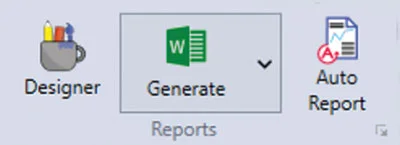
Reports toolbar. Image Credit: Gatan
EDS mapping
- The counts per second (CPS) map shows the count rate quality at each pixel to provide a CPS distribution and shows variances caused by surface characteristics
- For more exact representations of EDS maps, CompoMaps split contributions from overlapping peaks to specific elemental maps
- Users can choose from 40 color choices to create striking images during elemental mapping
- While mapping, users can easily activate and combine items to ease operation and inspection
- Concurrently map numerous element lines (K, L, M)
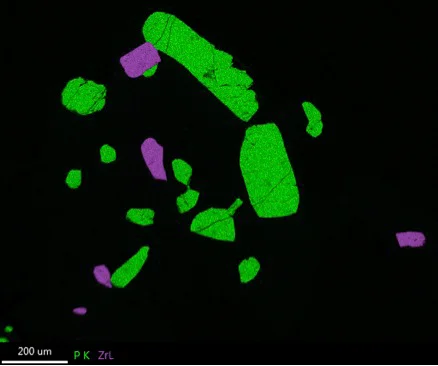
CompoMap shows separated P K and Zr L overlapping peaks. Image Credit: Gatan
Dynamic element mapping
- In the Linescan and Mapping modes, users can interact in real-time to display the elements
- During map collection, elements, element lines, and user-selected regions of interest can be edited
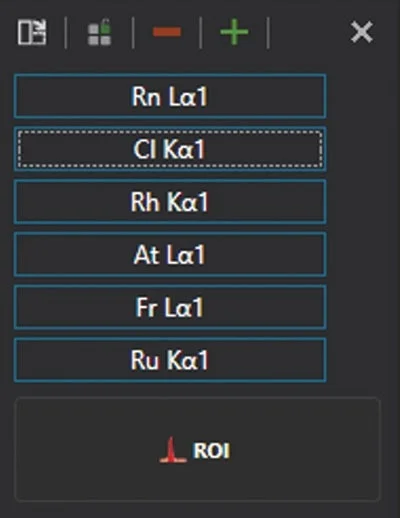
Dynamic Element Mapping window. Image Credit: Gatan
Montage large area mapping
- Using stage motions, large regions can be scanned to collect data from many fields of analysis
- Data stitching can be conducted automatically into a single file for comprehensive examination.
Smart phase mapping
- User setup is not required
- Elemental, spectra, and phase maps can be automatically collected
- The name and color of phases can be modified
- Phases can be predefined or reanalyzed based on spectra
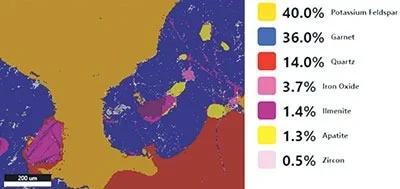
Smart Phase Mapping. Image Credit: Gatan
Dual detectors
- Reduces shadowing and topographic artifacts
- Compiles quantitative data from two detectors to get more precise findings
- Possibility of combining spectra/compositional maps from both detectors
- Greater resolution stability compared to systems with a single detector and a large sensor
- Increases count rate while maintaining single detector energy resolution
Enhanced linescan acquisition
- The linescan chart’s scale and real-time overlay enables simple connection of compositional data with image attributes
- Spectra collection can be set up for effective compositional gradient analysis
- By using linescan with drift correction in the APEX Advanced software suite, users can prevent sample mistakes
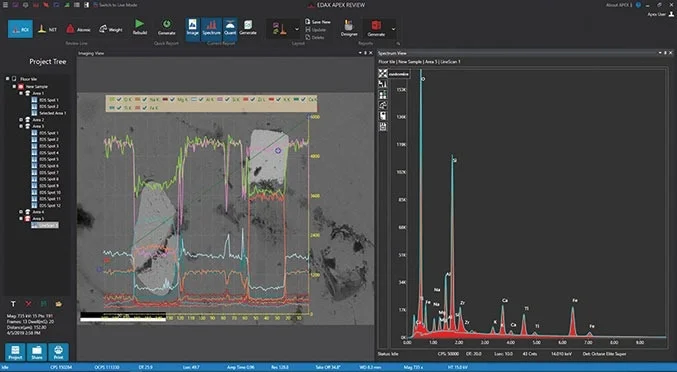
Advanced Linescan function. Image Credit: Gatan
Live drift correction
- Drift parameters can be automatically set for easy operation
- For effective correction performance, the correction frequency can be dynamically modified depending on the magnitude of the drift
- It is possible to record drift images and draw a manual reference region using advanced correction settings
- Linescan, Spectrum, and Mapping are available modes for quality data in all collection modes
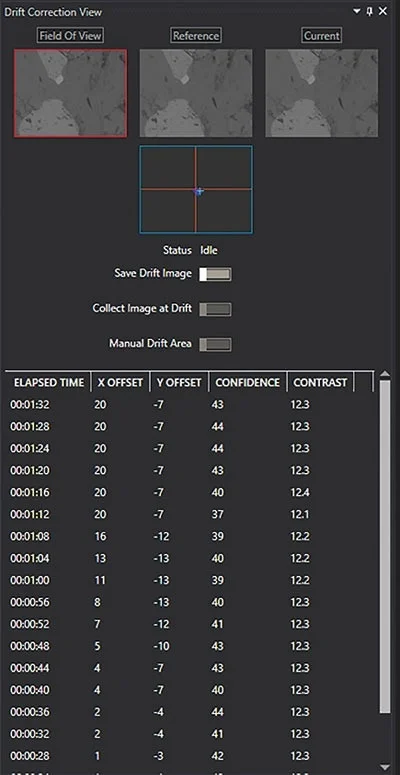
Drift Correction view panel. Image Credit: Gatan
Spectrum Match
- Spectrum Match users can design and utilize their custom spectrum libraries
- Users can search a spectrum library using the optional functionality to find spectra that are similar to their own
- Using the Smart Materials and Minerals Library option, a collected “unknown” spectrum can be compared to a collection of reference spectra
- Simplifies the process of identifying unknowns by comparing them to potential candidates and lowers the difficulty of spotting discrepancies and similarities between spectra