Sponsored by Park SystemsReviewed by Olivia FrostJan 28 2026
An automated method for measuring dynamic deformation across the full deflection range of a micromirror’s surface at its resonance frequency has been reported by DHM users at Silicon Austria Labs GmbH, the winner of the Lyncée Tec Challenge 2022.
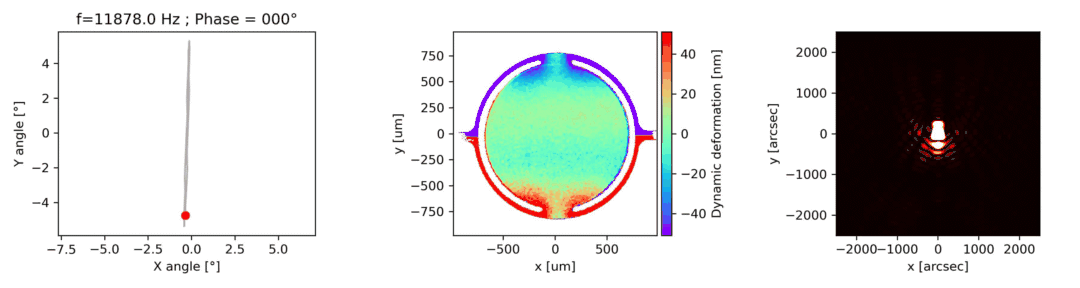
Dynamic deformation at resonant frequency and corresponding point spread function of the micromirror over its entire deflection range. Image Credit: Park Systems
A motorized goniometer integrated in the DHM® sample holder controls the tilt and tip of the microdevice. The stroboscopic module enables the synchronization of data acquisition, mirror deflection angle, and goniometer angles.
The reflective surface of the mirror is measured at each deflection angle when aligned perpendicular to the DHM®’s optical axis. This approach enables accurate quantification of dynamic deformation across the entire deflection range. Simulations can be effectively validated against experimental data to enhance MEMS design.
The workflow is fully automated and consists of four key steps.
1. Determination of the Resonance Frequency
As illustrated in Figure 1, the resonant response of the microdevice is established by conducting a frequency sweep and analyzing the intensity image data.
Due to interference patterns, increased mirror oscillation amplitudes lead to a reduction in the intensity measured by the DHM. A single measurement at each frequency is sufficient to identify the frequency associated with the maximum oscillation amplitude, ensuring rapid results.
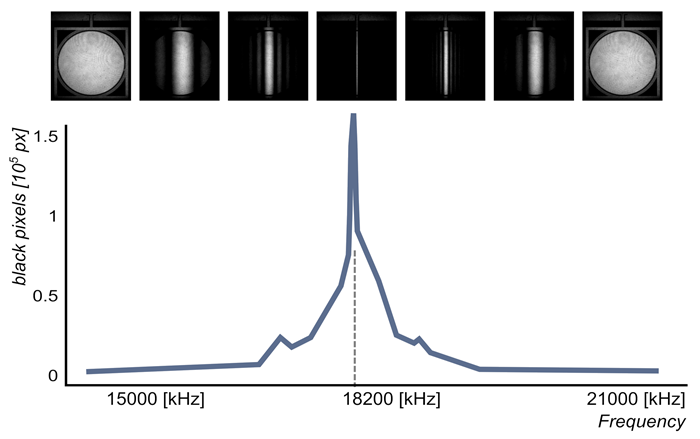
Fig 1. Intensity frequency scan. The frequency scanning step has been set to 200. This value sets the frequency resolution. Minimum steps are 0.1 Hz. Image Credit: Park Systems
2. Maximum Deflection Angle Determination
Intensity image data is also used to determine the maximum mirror deflection angle, as seen in Figure 2. The mirror is actuated at its resonance frequency while the goniometer automatically sweeps the tilt or tip of the microdevice.
The movement speed is lowest when the mirror oscillates at its maximum angle. Consequently, the goniometer angle corresponding to the highest amplitude in the intensity image indicates the maximum vibration angle.
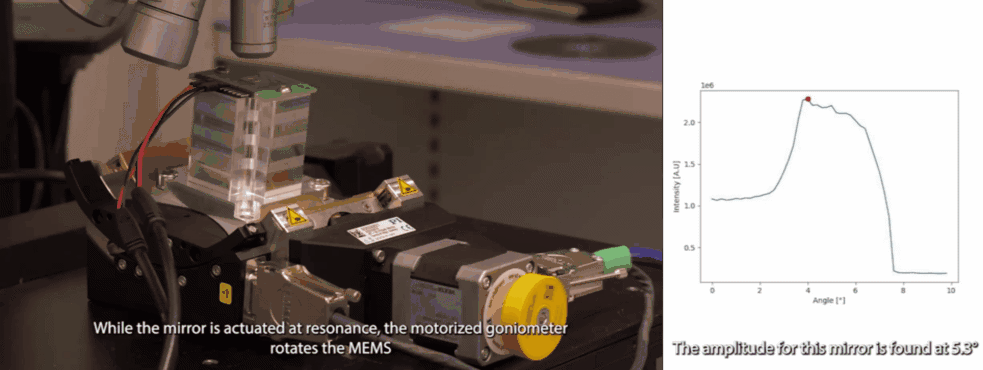
Fig 2. Maximum angle measurement using amplitude analysis. Image Credit: Park Systems
3. Micromirror Response Phase Shift at Resonant Frequency Adjustment
The phase difference between the mirror excitation signal and its response is measured by scanning the excitation signal phase offset while the goniometer is set at the maximum mirror deflection angle, as shown in Figure 3. The graph on the right shows the phase shift value as the median point of the graph depicting DHM image intensity versus the phase offset function.
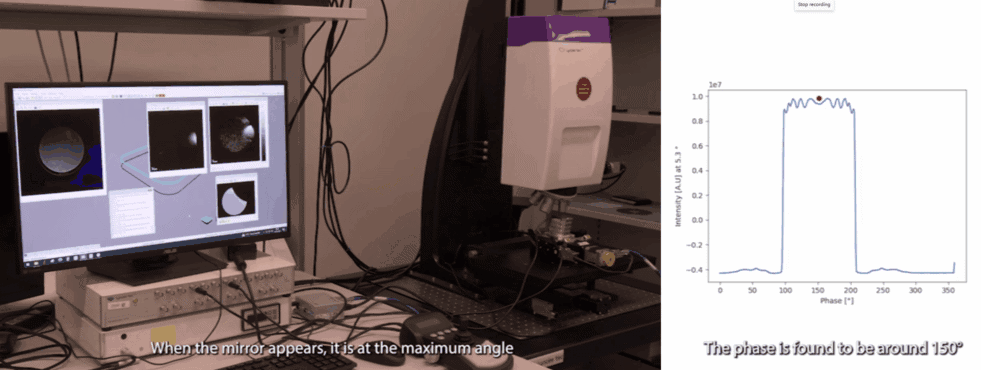
Fig 3. Determine the phase shift between mirror movement and excitation. Image Credit: Park Systems
4. Mirror Characterization Over the Full Deflection Angle Range
The motorized goniometer adjusts the tilt and tip of the microdevice based on the parameters calculated in the preceding steps. The reflective surface of the mirror is measured while positioned along its complete deflection range, maintaining perpendicular alignment with the optical axis of the DHM®, as illustrated in Figure 4.
This measurement can be interpreted as surface dynamic deformation, yielding a vibration map and an assessment of optical aberrations, as detailed in the following section.
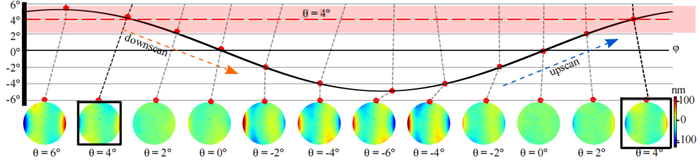
Fig 4. Slow axis upscan and downscan micromirror dynamical deformation for a scan angle of ±4 °. Image Credit: Park Systems
Optical Aberrations Characterization
Dynamic deformation measurements facilitate the evaluation of optical aberrations at any phase of the mirror's oscillations. For instance, at the maximum scan angle of the micromirror, trefoil is observed in the fast axis, while the slow axis exhibits both trefoil and comma distortions.
In the specific case shown in Figure 5, the slow axis exhibits a dynamic deformation of 250 nm, resulting in an eight % reduction in contrast to the diffraction limit for the same aperture.
The observed hysteresis in this axis, characterized by a 45 nm difference in dynamic deformation between upscan and downscan, accounts for a 0.6 % loss in contrast. The fast axis exhibits a dynamic deformation of 1600 nm, resulting in a 96 % reduction in contrast. In fast axis mode, image quality deteriorates as the angle increases.
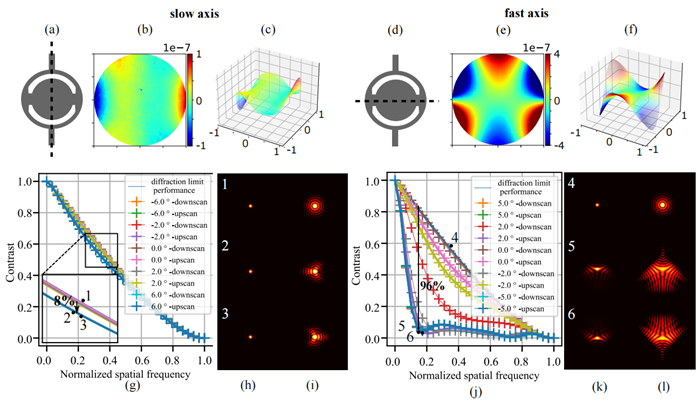
Fig 5. The surface plot of measured dynamic deformation at maximum scan angle. Aberrations such as Trefoil are visible for the fast axis. The slow axis has Trefoil and Comma as dominant aberrations. The modulation transfer function resulting from deformation in the mirror when operating in torsion mode and bending mode is presented in the plots, respectively. Image Credit: Park Systems
I am very much impressed by the DHM, on how we can use the laser trigger pulses down to 7.5 ns and record the high resolution- surface topographies of a high-speed scanning micromirrors. We received support from Yves on improving our measurements, to deal with high velocity at zero crossing of mirror. Also, I am grateful for his immediate responses and contribution to paper reviewing within a short notice period.
Pooja Thakkar, Junior Scientist, Photonic Systems, Silicon Austria Labs
Besides having good enough resolution in all 4 dimensions to image such a small and mechanical deformation, the key aspect of stroboscopic holography for high deflection MEMS mirror is to explore the parameter window space first (full field) contrary to a scanning technique – i.e LDV – that would do it frequency first. This enables easy and precise measurement, and a straightforward processing scheme.
Clement Fleury, Senior Researcher, Photonic Systems, Silicon Austria Labs
Experimenal characterization of dynamic deformation at larger optical scan angles has for long time remained underexplored. Digital holographic microscopy offers superior lateral, axial and temporal resolution, allowing us to study peculiar effects in angle resolved membrane dynamics. Lyncée Tec offers you the right tool for the job.”
Dr. Jaka Pribošek, Senior Scientist, Photonic Systems, Silicon Austria Labs

This information has been sourced, reviewed, and adapted from materials provided by Park Systems.
For more information on this source, please visit Park Systems.