The purpose of this work is to present a practical workflow for measuring strain rate sensitivity (SRS) using KLA Instruments™ SRX™ high strain rate nanoindentation. Building on the theoretical framework introduced previously, the underlying concepts are translated into a repeatable experimental procedure for acquiring and interpreting SRX data.
In this framework, nanoindentation is used as a screening tool for rapid comparison of materials, processing conditions, and microstructures. By localizing deformation beneath the indenter, SRX enables efficient access to rate-dependent behavior while maintaining control of deformation conditions and data fidelity.
Sample Preparation for SRX Analysis
Sample preparation for SRX testing follows the same general principles as conventional nanoindentation, i.e., the surface must be flat over the region of interest and the specimen must be rigidly supported during testing. These requirements directly influence measurement accuracy and scatter in the resulting data.
- Surface Roughness: Surface condition is typically the dominant contributor to variability. As a practical guideline, surface roughness should be small (∼5%) relative to the analysis depth, as described in ISO 14577.
- Sample Flatness: Surface tilt introduces systematic error in the projected contact area and therefore in hardness, and should be limited to ± 1°, per ISO 14577 or ASTM E2546.
NOTE: Given a 1° tilt limit over the test area of interest, the minimum convex/concave sample radius can be calculated as
R ≈ L / θ
where L is the array length, and θ is the tilt in radians, i.e., a 200 µm array requires a minimum sample radius of about 6 mm when tested at the apex.
- Sample Fixturing: The specimen's mechanical stability is also essential. The mounting condition must not introduce additional compliance during testing, as this directly affects displacement measurement and derived properties. Rigid mounting, typically achieved through adhesive bonding to a stiff support, ensures that measured displacement reflects material deformation rather than mounting artifacts.
- Films and Coatings: For thin films and coatings, substrate influence must be considered. A common guideline is that indentation depth should be <10% of the coating thickness when evaluating hardness. When applied to SRX measurements, this constraint defines both the usable depth range and the required surface finish for reliable analysis.
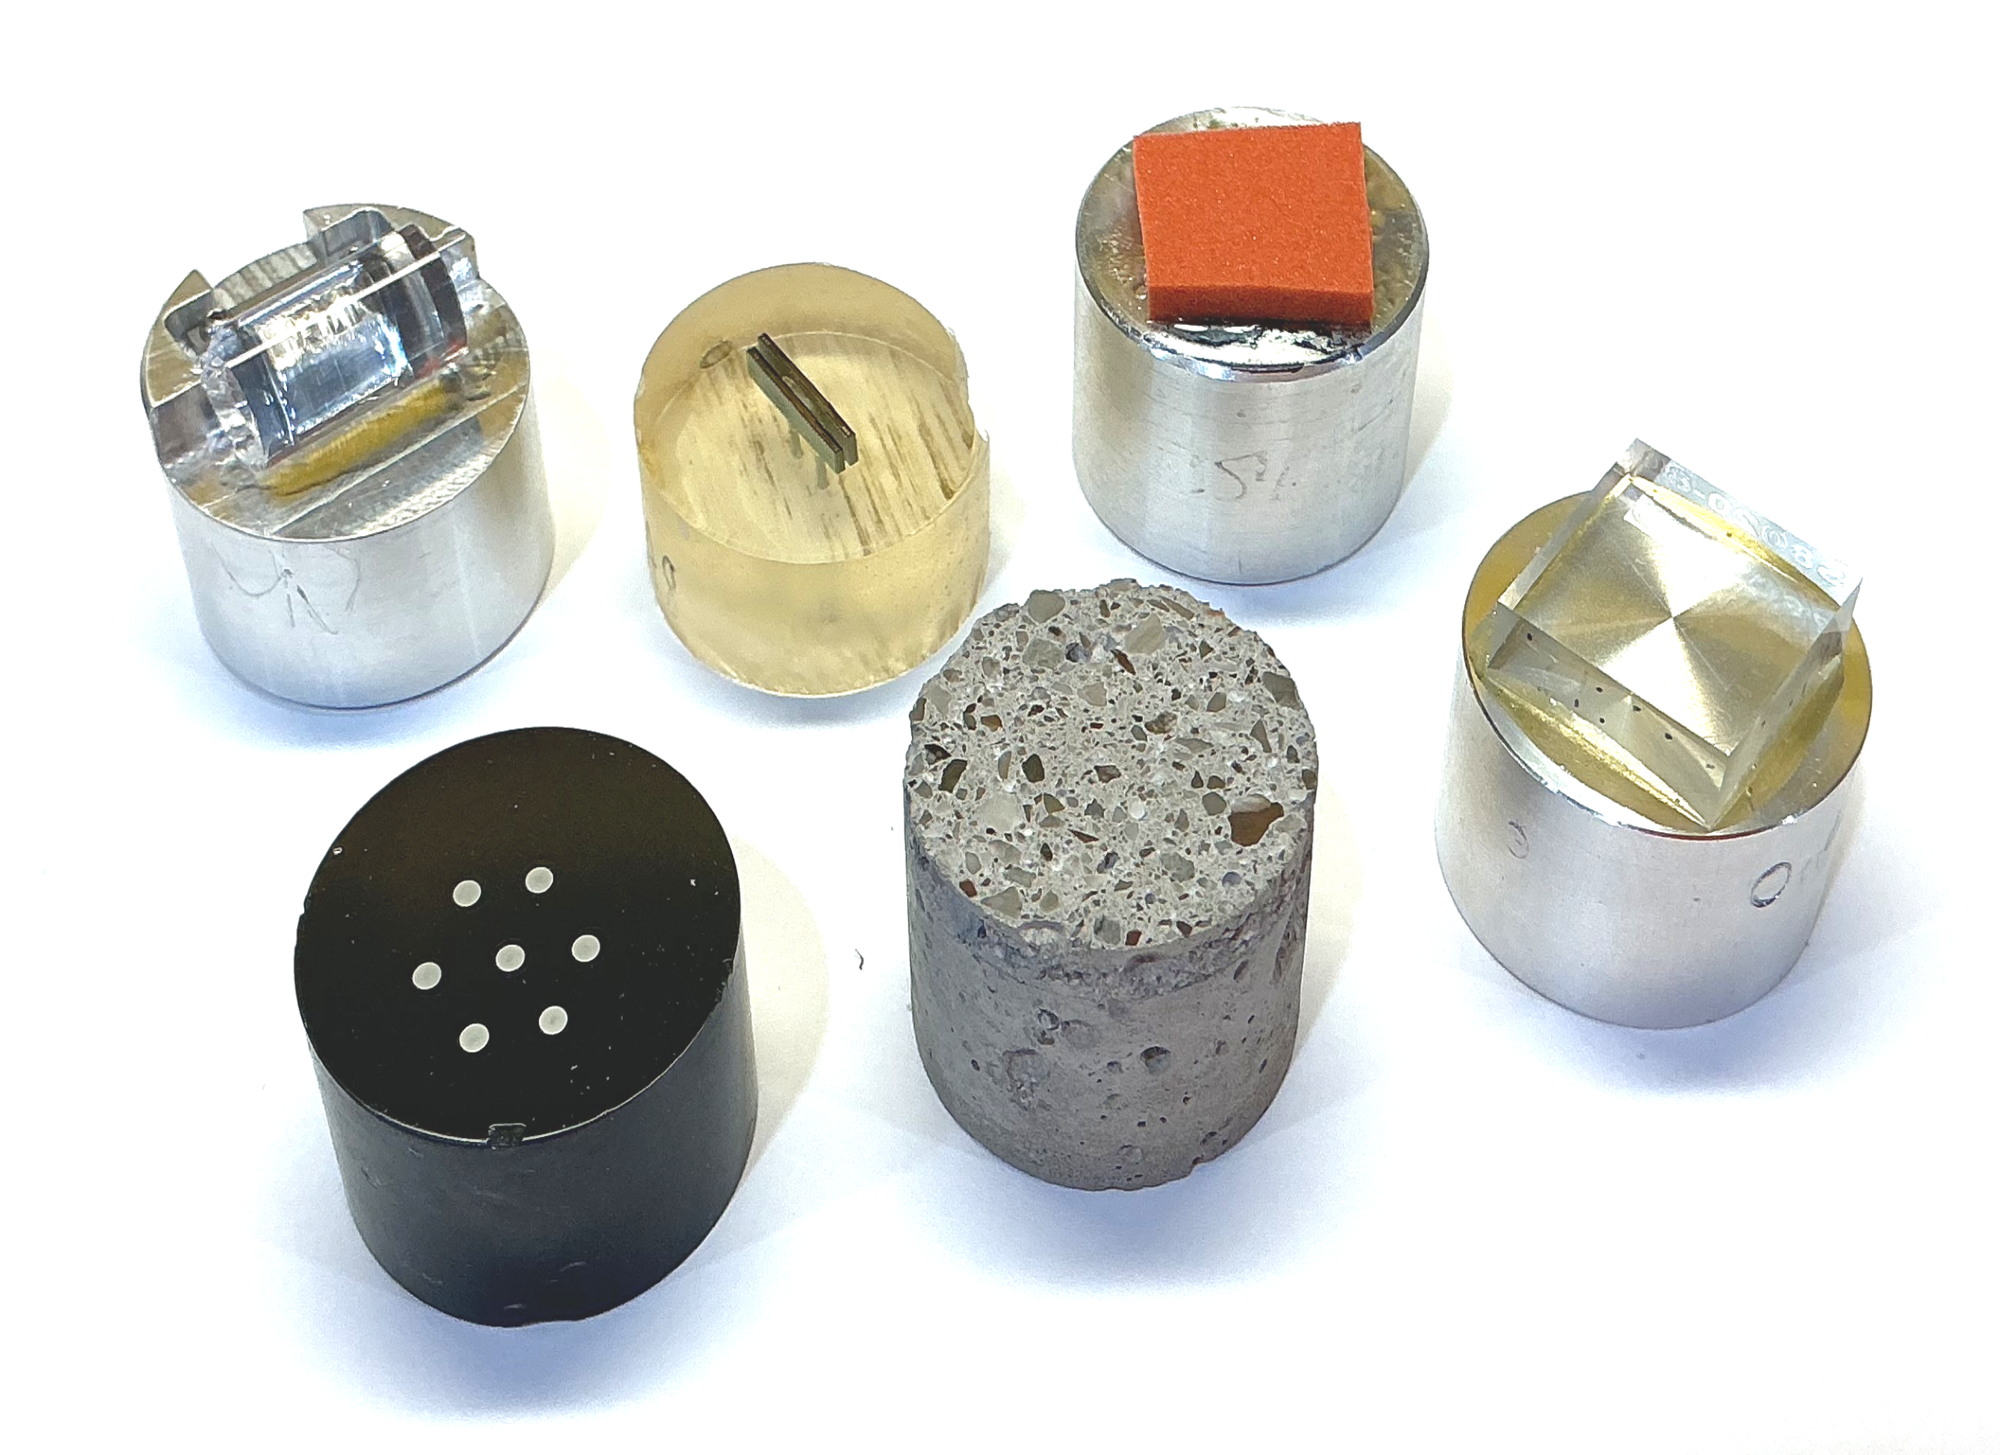
Figure 1. Various mounts for testing samples using SRX analysis. Image Credit: KLA Instruments™
Nanoindenter Tip Calibration
Prior to testing, the indenter response and contact area must be well characterized. Area function calibration is performed using fused silica and a Berkovich indenter using continuous stiffness measurement (CSM) indentation.
The resulting data is used to determine the indenter area function and to verify that measured modulus and hardness values match accepted reference values, ensuring the accuracy of contact area and derived properties over depth.
Baseline measurements of hardness, modulus, and load–displacement behavior on the sample of interest, before SRX testing, support the interpretation of high strain rate data, especially for heterogeneous or anisotropic materials.
Test Input Parameters
SRX testing is performed by executing a sequence of indentation tests, each conducted at a controlled constant strain rate. This sequence produces a series of deformation conditions spanning a range of rates, enabling evaluation of rate-dependent material strength as a function of depth.
The resulting dataset can be interpreted tomographically, allowing the user to select depth ranges that minimize the influence of surface roughness, indentation size effects, and substrate contributions.
A small number of input parameters define the SRX test sequence:
- The starting strain rate sets the initial deformation rate for the first test in the sequence.
- The strain rate decrement factor controls how strain rate is reduced between successive tests, defining the spacing of the rate spectrum.
- The constant strain rate finish depth defines a depth-based termination condition.
- The constant strain rate finish load defines a load-based termination condition.
- Hold time provides a dwell period at maximum load, allowing time-dependent deformation mechanisms to evolve.
Both termination conditions are evaluated concurrently during testing, and the test concludes when either limit is reached. In practice, one parameter is typically designated as the primary stopping condition, while the other is set sufficiently high to avoid prematurely terminating the test.
Table 1 provides a list of inputs with example input values and typical ranges for those values.
Table 1. SRX Inputs for analyzing strain rate sensitivity. Source: KLA Instruments™
| Test Input |
Example Value |
Typical Range |
| Starting Strain Rate |
1000 s-1 |
100 to 5000 s-1 |
| Strain Rate Decrement Factor |
0.8 |
0.5 to 1 |
| Constant Strain Rate Finish Depth |
3 µm |
0.3 to 10 µm |
| Constant Strain Rate Finish Load |
50 mN |
1 to 1000 mN |
| Hold Time |
10 seconds |
1 to 100 seconds |
Selection of input parameters should ensure that inertial contributions remain small and that a stable depth window exists for analysis. The starting strain rate and decrement factor define the accessible rate spectrum, while the finish conditions must allow sufficient depth to minimize both surface and substrate effects.
Execution of the SRX Test Sequence
Each SRX test follows a consistent sequence:
- The indenter approaches the surface and establishes contact.
- The system imposes a constant indentation strain rate during loading.
- Loading continues until the specified stopping condition is met.
- The load is held constant for a defined dwell period.
- The indenter unloads and moves to the next test location.
This sequence is repeated across the test array, producing a dataset that spans a continuous range of strain rates.
As an example, SRX was used to test polymethyl methacrylate (PMMA), a homogeneous polymer, to generate a series of tests that span orders of magnitude in strain rate.
Each test produced a distinct load-time response, reflecting the material's rate-dependent resistance. Because constant strain rate control requires velocity to increase with depth, the loading response exhibits a characteristic nonlinear time dependence during indentation.
Figure 2 shows the load-versus-time history for seven of the tests in a 30-indent array. Strain rates shown range from 250 s-1 (purple) to 1000 s-1 (blue) during loading. For clarity, only seven tests are shown. The time scale on the X-axis is listed in milliseconds and reflects the rapid loading and completion of each test.
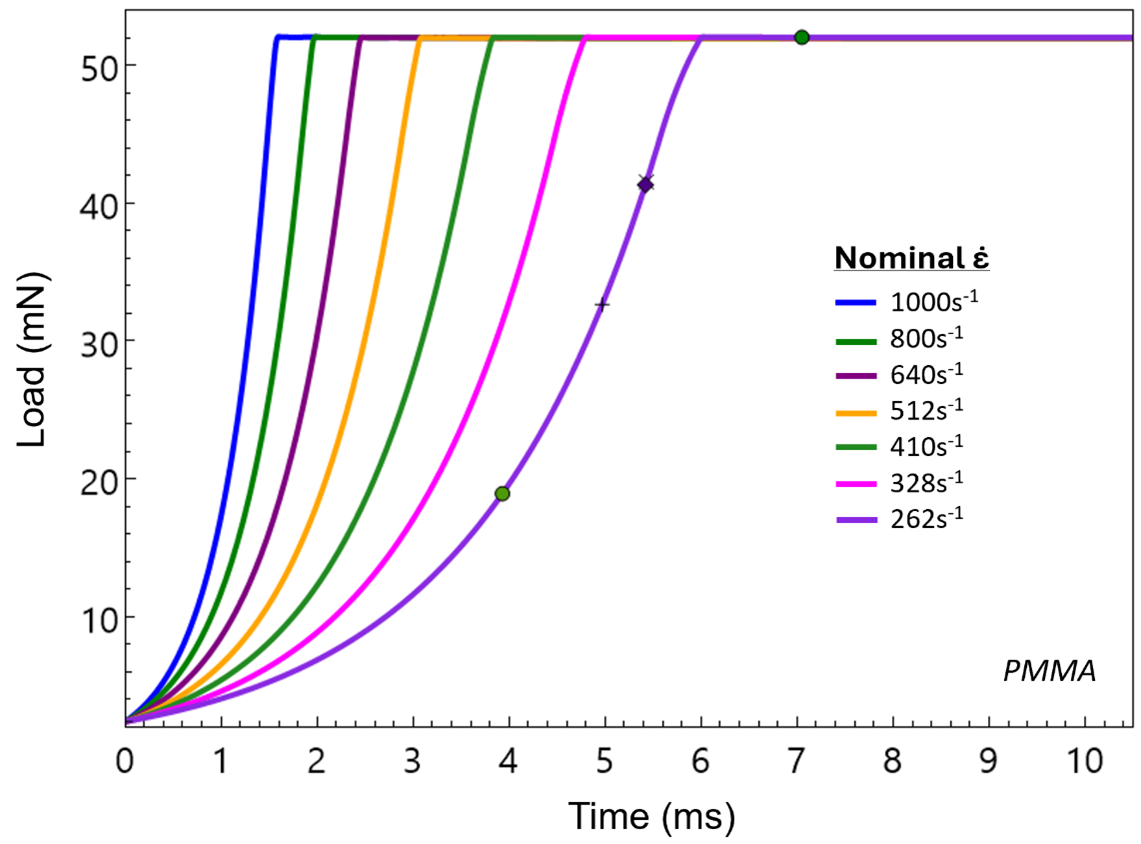
Figure 2. Load vs. time data for SRX analysis in the array scanning strain rates from 250 s-1 to 1000 s-1. Image Credit: KLA Instruments™
Evaluation of Data Quality
Accurate evaluation of strain rate sensitivity requires verification that the measured response reflects material behavior rather than instrument artifacts. Two checks are essential for all high-rate indentation data:
- Quantify inertial load contributions
- Confirm constant strain rate control over the analysis depth.
These checks are complementary: inertial analysis ensures force fidelity, while strain rate verification ensures consistent deformation control.
At high strain rates, motion of the indenter mass introduces additional force contributions arising from acceleration and damping. These inertial effects are described by a single-degree-of-freedom harmonic oscillator, in which total force includes terms proportional to both acceleration and velocity.

where:
- m is the mass of the indenter
- c is the damping
- h is the indentation depth.
Unlike quasi-static indentation, where inertial effects are negligible, high-rate testing can produce conditions in which inertial contributions constitute a significant fraction of the total applied force.
As a practical constraint, inertial loading should remain below the dominant contribution from material resistance in the region of interest. When this condition is satisfied, the measured load-displacement response can be interpreted primarily as a material response rather than a system response.
Figure 3 shows a graph of the inertial contributions to load as a function of depth for the SRX tests conducted on the PMMA sample. PMMA data showed that the contribution of inertial force to the load on the sample is no more than 5%, even at strain rates of > 1000 s-1.
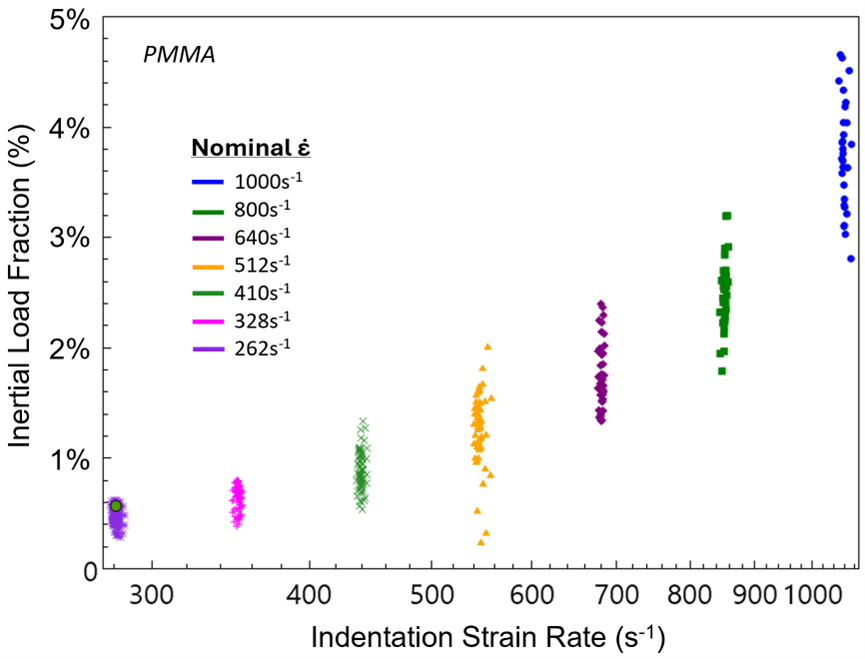
Figure 3. Inertial load expressed as a fraction of total applied force during the indentation tests on PMMA. Inertial load should be minimized to maximize the contribution from actual material response. Image Credit: KLA Instruments™
A second requirement is that the applied indentation strain rate remains constant over the depth range used in the analysis. If strain rate varies during deformation, the measured hardness reflects a convolution of rate-dependent and transient deformation mechanisms, making interpretation ambiguous.
Verification of strain rate control is therefore performed by evaluating the indentation strain rate as a function of depth, and PMMA testing showed < 4% variation in strain rate control over the depth range.
For well-controlled SRX data, deviations from the commanded rate are small over the usable depth range, enabling consistent comparison of hardness across tests. Figure 4 shows the measured indentation strain rate for PMMA tests as a function of depth.
Together, these two verifications ensure that the dataset is both instrumentally valid and physically interpretable prior to extracting strain rate sensitivity.
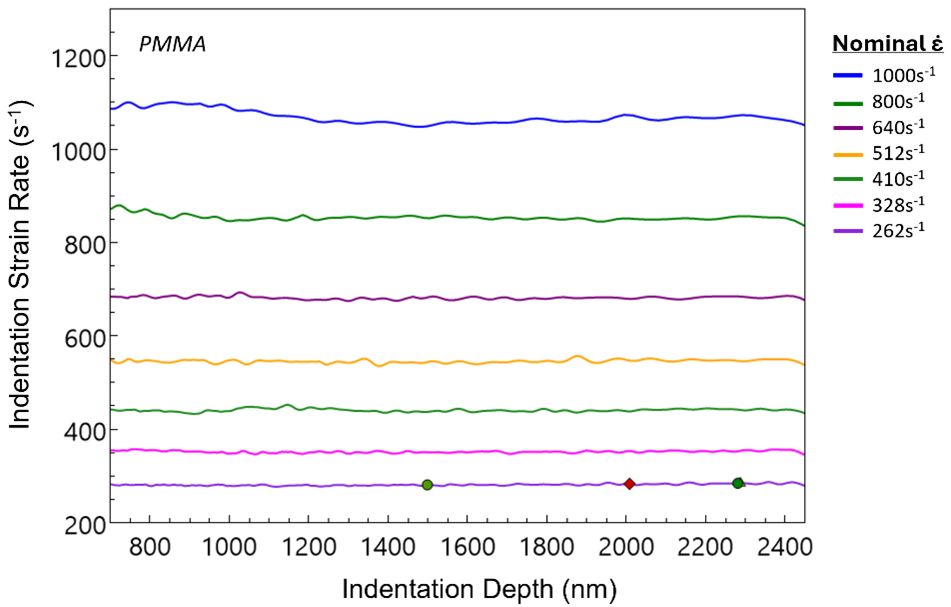
Figure 4. Indentation strain rate as a function of indentation depth for the PMMA sample. Results show less than 4% deviation in strain rate control over the depth range. Note that the strain rate vs. depth results are plotted linearly to clearly show the deviation, which is not as obvious when plotted logarithmically. Image Credit: KLA Instruments™
Interpreting Strain Rate Plots
Assessment of constant strain rate control depends on data visualization.
Logarithmic plotting can compress variation, making deviations from the commanded strain rate appear smaller than they are. As a result, changes in strain rate may not be readily apparent.
For data quality assessment, strain rate should be evaluated on a linear scale versus depth, where variations in control are clearly resolved.
Determining Strain Rate Sensitivity
Once data quality has been verified, strain rate sensitivity can be evaluated by examining the relationship between hardness and indentation strain rate.
In SRX testing, hardness serves as the strength-like response, analogous to flow stress in uniaxial testing. Because hardness can be affected by surface roughness, indentation size effects, and substrate interactions, the analysis must be performed over a consistent depth range across all tests in the array.
The selected depth range represents a tomographic slice of the dataset. By evaluating all tests over a depth range that minimizes size effects while preventing undue substrate influences (for films and coatings), the comparison ensures that measured hardness differences reflect rate-dependent behavior rather than geometric or microstructural artifacts.
Figure 5 shows a log-log plot of hardness vs. strain rate for the PMMA data over the indentation depth range of 1500 nm to 2000 nm.
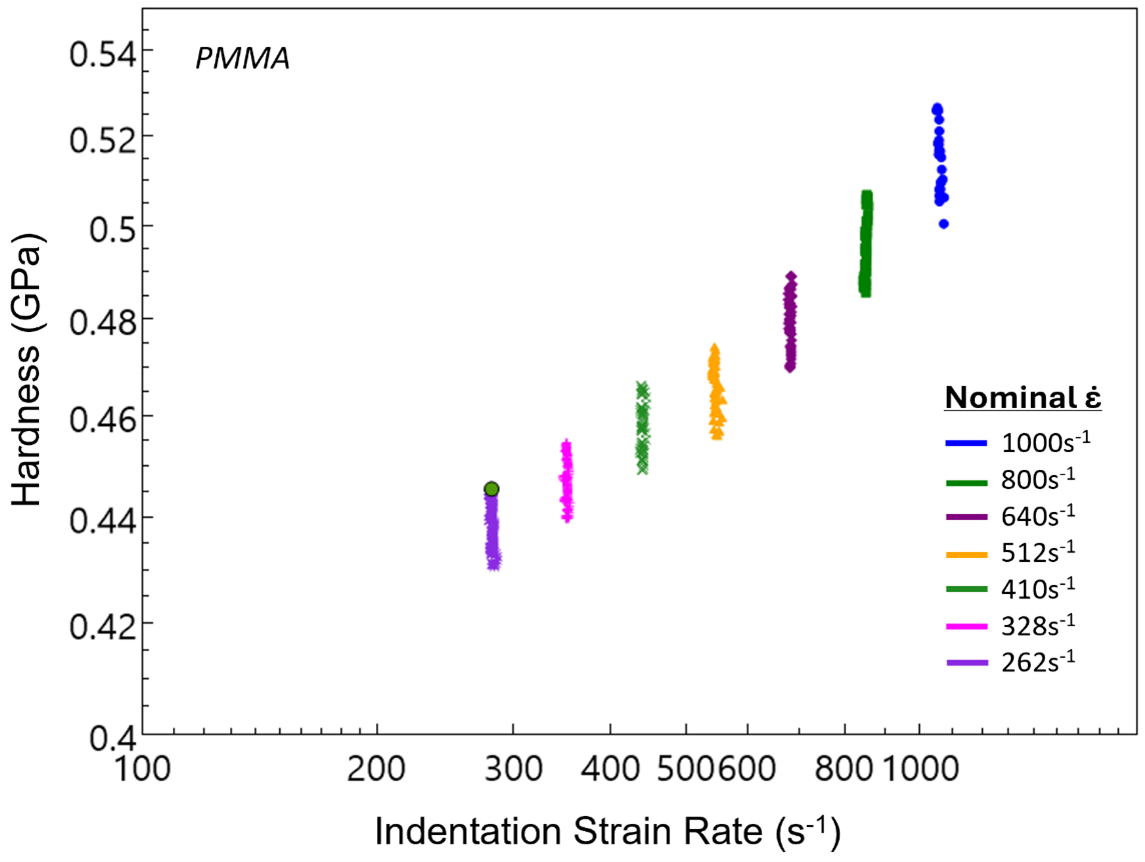
Figure 5. Log-log plot of strain rate vs. hardness for seven indentation tests on PMMA. Image Credit: KLA Instruments™
The resulting hardness values are then evaluated as a function of indentation strain rate on logarithmic axes. Under constant strain and temperature conditions, strain rate sensitivity is defined as the slope of this relationship:

In practice, hardness values at each strain rate are averaged over the selected depth range to reduce scatter and improve stability of the fit. A linear trend in log-log space indicates a well-defined rate-dependent response. The strain rate versus average hardness results for all tests in the array on PMMA are plotted in Figure 6.
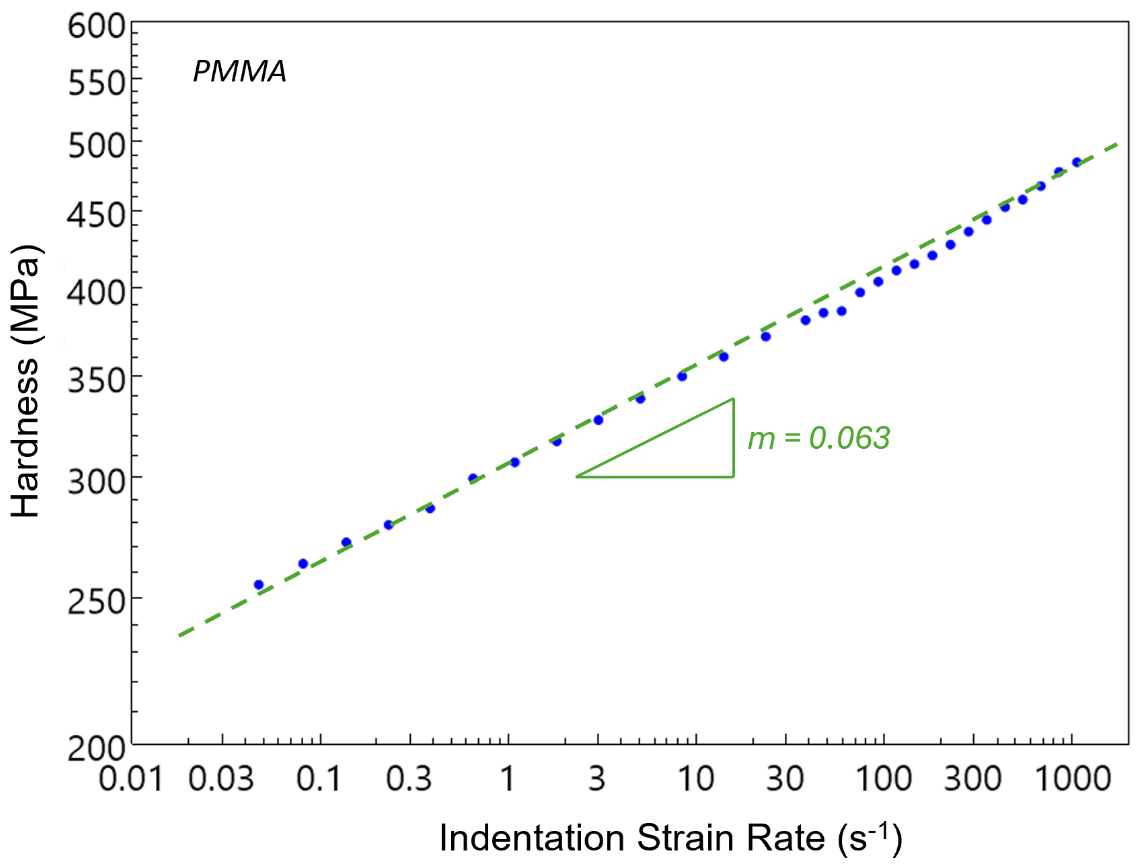
Figure 6. Log-log plot of strain rate vs. average hardness for the array of tests on PMMA. Strain rate sensitivity (SRS) on PMMA was measured as 0.063, determined by the least-squares method to identify the slope in log-log space. Image Credit: KLA Instruments™
The extracted slope, m, was determined by least-squares fit to the log-log data and provides a quantitative measure of how strongly material strength depends on deformation rate:
- Low values of m indicate weak rate dependence
- Higher values of m indicate strong rate-dependent strengthening.
Because SRX generates a continuous spectrum of strain rates within a single test array, this approach provides a consistent and efficient method for evaluating strain rate sensitivity across materials, processing conditions, and microstructures.
Impact of SRS on Materials Design
In engineering applications, materials are rarely subjected to slow, controlled loading conditions. Instead, they often experience rapid deformation during events such as impacts, collisions, or high-speed actuation. Under these conditions, material response depends not only on applied stress or strain, but also on deformation rate.
Strain rate sensitivity directly influences how a material behaves under these dynamic conditions. As strain rate increases:
- Measured strength typically increases
- Time-dependent deformation mechanisms are suppressed
- Energy absorption and resistance to deformation can improve
- Ductile to brittle transition can occur at lower stress limits.
Conversely, materials with low strain rate sensitivity may exhibit limited strengthening under dynamic loading but may provide more stable rate-dependent deformation; performance relies on optimizing strain rate sensitivity over the application range.
SRX testing provides a practical way to assess how strength evolves with deformation rate. Localizing deformation beneath the indenter enables measurement of strain rate sensitivity using small samples and straightforward test conditions. This technique significantly reduces the complexity and resource requirements associated with conventional high-rate testing methods.
In this context, SRX serves as a materials screening tool within development workflows. It enables rapid comparison of materials, coatings, and processing conditions, allowing users to:
- Identify rate-sensitive behavior,
- Rank candidate materials, and
- Down-select options for further testing.
For research applications, SRX accelerates exploration of rate-dependent deformation mechanisms. For industrial applications, it enables faster iteration and optimization by focusing resources on the most promising materials.
Example Results for Common Materials
SRS values were measured using SRX testing across a range of material classes. The results are included to illustrate the range of behavior captured by the technique and to provide comparison with established literature values.
Table 2 summarizes the measured strain rate sensitivity results for 10 common materials, alongside representative ranges reported in the literature. Agreement between measured and reported values validates both the SRX methodology and test execution.
Figure 7 displays the log-log plot of hardness vs. strain rate for the materials measured using SRX.
Table 2. SRX analysis results for various materials shown in Figure 7; measured SRS results used the least-squares method to identify the slope in log-log space. Source: KLA Instruments™
| Material |
Material Class |
Measured SRS |
Literature Value Range |
| Sapphire (X2) |
Ceramic |
0.012 |
0.0–0.02 |
| Fused Silica |
Ceramic |
0.007 |
0.003–0.01 |
| Calcium Fluoride |
Ceramic |
0.064 |
0.03–0.08 |
| Nickel |
Metal |
0.022 |
0.02–0.025 |
| Titanium (X2) |
Metal |
0.015 |
0.01–0.05 |
| Selenium (X2) |
Metal |
0.055 |
0.03–0.08 |
| Aluminum |
Metal |
0.052 |
0.01–0.05 |
| PMMA |
Polymer |
0.067 |
0.05–0.081 |
| Bismuth |
Metal |
0.068 |
0.05–0.12 |
| Polycarbonate |
Polymer |
0.018 |
0.02–0.033 |
1. Derived from yield stress vs. strain rate data using an Eyring-type framework (Bauwens-Crowet, 1973)
2. Values inferred from the rate-dependent flow behavior reported in Skudnov et al. (1969)
3. Estimated from slope of stress vs. log(strain rate) reported by Kendall & Siviour (2014)
Across material classes, clear differences in strain rate sensitivity are observed. Ceramics such as fused silica and sapphire exhibit low strain rate sensitivity, consistent with limited dislocation activity and deformation dominated by elastic or brittle mechanisms.
In contrast, polymers and amorphous materials show higher sensitivity, reflecting viscoplastic and time-dependent deformation processes. Metals generally fall between these extremes, with behavior governed by dislocation motion and thermally activated mechanisms.
These results demonstrate that SRX testing captures physically consistent trends across diverse material systems, supporting its use as a method for evaluating rate-dependent mechanical behavior.
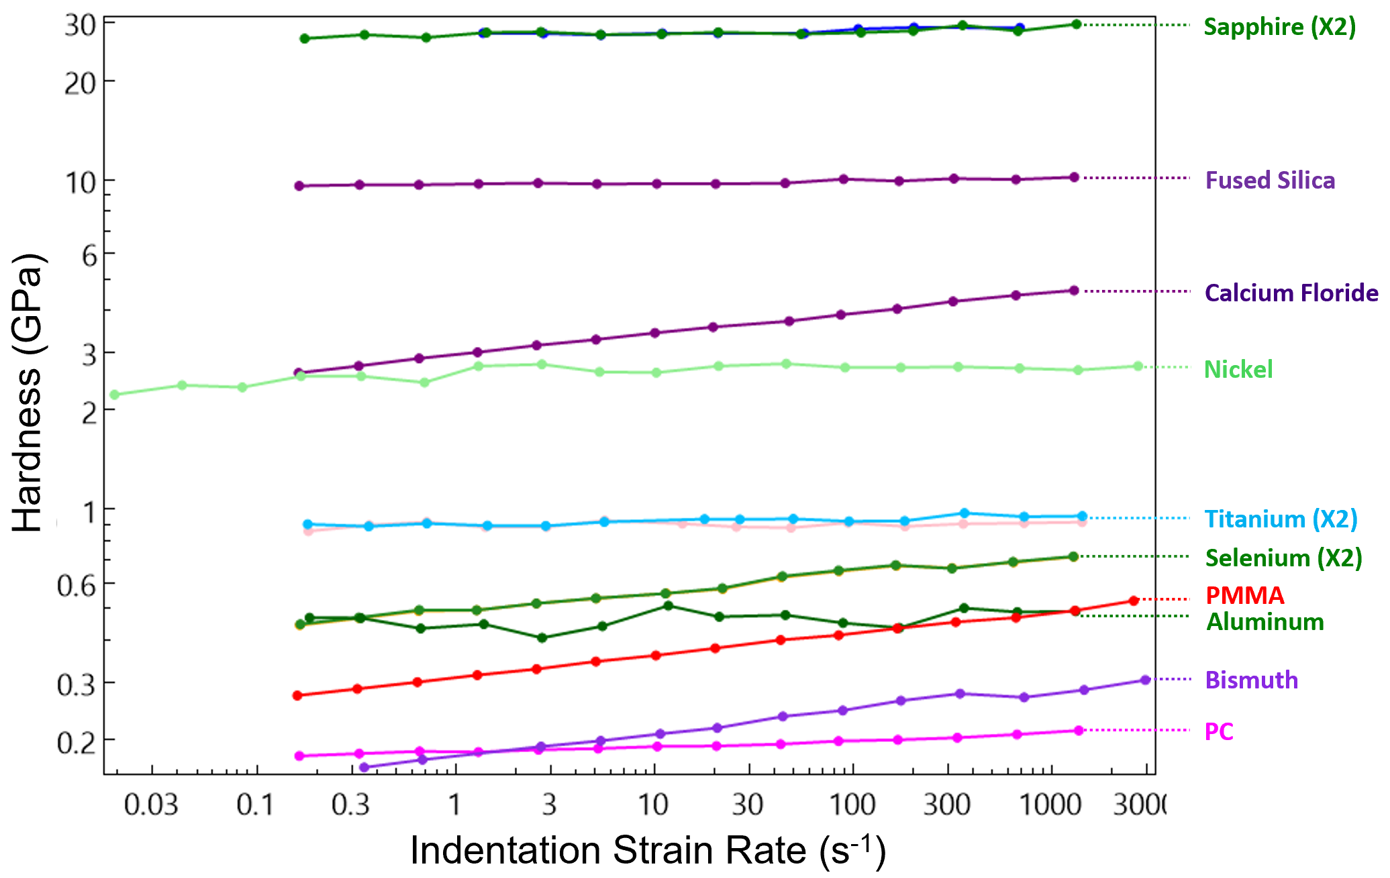
Figure 7. Hardness vs. strain rate for multiple materials using SRX graphed on a log-log plot; replicate measurements are denoted using X2. Image Credit: KLA Instruments™
Further Reading
References
- Hay, J., et al. (2013). Strain-Rate Sensitivity (SRS) of Nickel by Instrumented Indentation. Conference Proceedings of the Society for Experimental Mechanics Series, pp.47–52. DOI:10.1007/978-1-4614-4436-7_8. https://link.springer.com/chapter/10.1007/978-1-4614-4436-7_8.
- Widmer, R.N., et al. (2022). Temperature–dependent dynamic plasticity of micro-scale fused silica. Materials & Design, 215, p.110503. DOI:10.1016/j.matdes.2022.110503. https://www.sciencedirect.com/science/article/pii/S0264127522001241.
- Frisch, A., et al. (2025). Room-temperature dislocation plasticity in ceramics: Methods, materials, and mechanisms. Journal of the American Ceramic Society, 108(9). DOI:10.1111/jace.20575. https://ceramics.onlinelibrary.wiley.com/doi/10.1111/jace.20575.
- Zhang, J., et al. (2018). Strain Rate Sensitivity of Tensile Properties in Ti-6.6Al-3.3Mo-1.8Zr-0.29Si Alloy: Experiments and Constitutive Modeling. Materials (Basel, Switzerland), 11(9), p.1591. DOI:10.3390/ma11091591. https://www.mdpi.com/1996-1944/11/9/1591.
- Su, C., et al. (2010). Plastic instability in amorphous selenium near its glass transition temperature. Journal of Materials Research, 25(6), pp.1015–1019. DOI:10.1557/jmr.2010.0141. https://link.springer.com/article/10.1557/JMR.2010.0141.
- Sudharshan Phani, P. and Oliver, W.C. (2017). Ultra High Strain Rate Nanoindentation Testing. Materials (Basel, Switzerland), 10(6), p.663. DOI:10.3390/ma10060663. https://www.mdpi.com/1996-1944/10/6/663.
- Bauwens-Crowet, C. (1973). The compression yield behaviour of polymethyl methacrylate over a wide range of temperatures and strain-rates. Journal of Materials Science, 8(7), pp.968–979. DOI:10.1007/bf00756628. https://link.springer.com/article/10.1007/BF00756628.
- Skudnov, V.A., et al. (1969). Mechanical properties of bismuth at different temperature and strain rates. Metal Science and Heat Treatment, 11(12), pp.981–984. DOI:10.1007/bf00654940. https://link.springer.com/article/10.1007/BF00654940.
- Kendall, M.J. and Siviour, C.R. (2014). Experimentally simulating high-rate behaviour: rate and temperature effects in polycarbonate and PMMA. Philosophical transactions. Series A, Mathematical, physical, and engineering sciences, 372(2015), p.20130202. DOI:10.1098/rsta.2013.0202. https://royalsocietypublishing.org/rsta/article-abstract/372/2015/20130202/59066/Experimentally-simulating-high-rate-behaviour-rate?redirectedFrom=fulltext.
- ISO. International Organization for Standardization (ISO). ISO 14577-1:2015 – Metallic materials – Instrumented indentation test for hardness and materials parameters – Part 1: Test method. ISO. Available at: https://www.iso.org/standard/56626.html.
- ASTM International. ASTM E2546-15(2020) – Standard Practice for Instrumented Indentation Testing. ASTM International, West Conshohocken, PA, USA, 2020.

This information has been sourced, reviewed, and adapted from materials provided by KLA Instruments™.
For more information on this source, please visit KLA Instruments™.