Nanoparticles (NPs) are a key building block in the production of novel materials with enhanced characteristics, for example, mechanical, thermal, or optical.1 Parameters like the particle shape, concentration, and size must be carefully managed to adhere to cost, safety, and performance requirements.
SAXS is a well-respected method for traceable size measurements.2, 3, 4
It was recently demonstrated that the number concentrations of NPs could be accurately calculated from SAXS data gathered at synchrotron facilities with metrological traceability to the standard system of units (SI).5
This article shows that traceable number concentrations can also be acquired utilizing a SAXS laboratory system with acquisition times of 10 minutes.
Small Angle X-ray Scattering (SAXS) is a non-destructive method that allows the structure of materials to be determined with limited sample preparation. It is effective when used with microscopy, as it can be used for in situ measurements and offers statistically relevant quantitative data across a large scattering volume (normally 1 mm3).
Particle sizes from 1 to 250 nm can be detected by SAXS. For particles bigger than 100 nm, a vertical system such as the Nano-inXider reduces sedimentation when concentration measurements are performed.
The reliable theoretical framework of X-ray scattering offers a traceable connection to SI units for number concentrations, a feature it shares exclusively with single-particle inductively coupled plasma mass spectrometry (spICPMS).
Measurements
A certified concentration standard from LGC (colloidal dispersions of citrate-stabilized gold NPs, number concentration 1.47E11±2.8E10 particles per mL, modal diameter 30.7 nm, product code LGCQC5050)6 has been measured as received and in dilution series.
A Nano-inXider instrument was used to perform the measurements in a flowcell where the thickness was established from the transmission value. Before being injected into the measurement flowcell, each sample was manually shaken in a gentle manner. They were then measured for 10 minutes as well as the dispersion medium’s (water with citrate buffer) to determine its background scattering contribution.
A micro-balance was used to control dilution errors where weighing repetition uncertainties were considered in the final concentration results.7
The XSACT software was used to analyze the scattering data8. The transmitted intensity is automatically detected by the instrument, which presents data in absolute units, which is a requirement when quantitatively calculating the number concentration.
The scattering profiles were fitted against a spherical form factor with a lognormal size distribution after data reduction9, which displayed the number concentration of the dispersions, the particle size, and the polydispersity. The scattering length density for gold in water was determined to be 1.159E12 cm-2. Integrating the area under the size distribution histogram provides the total number concentration.
Results
Figure 1 presents the scattering profiles of the gold dispersions. The average size of 28.9 nm is exhibited by the gold NPs, compared to 30.7 nm on the certificate (value from electron microscopy).
Calculated by SAXS, the number concentration of the as-received dispersion is 1.39E11 ± 0.7E10 particles per mL. This is highly consistent with the sample certificate (1.47E11 ± 2.8E10 particles per mL).6
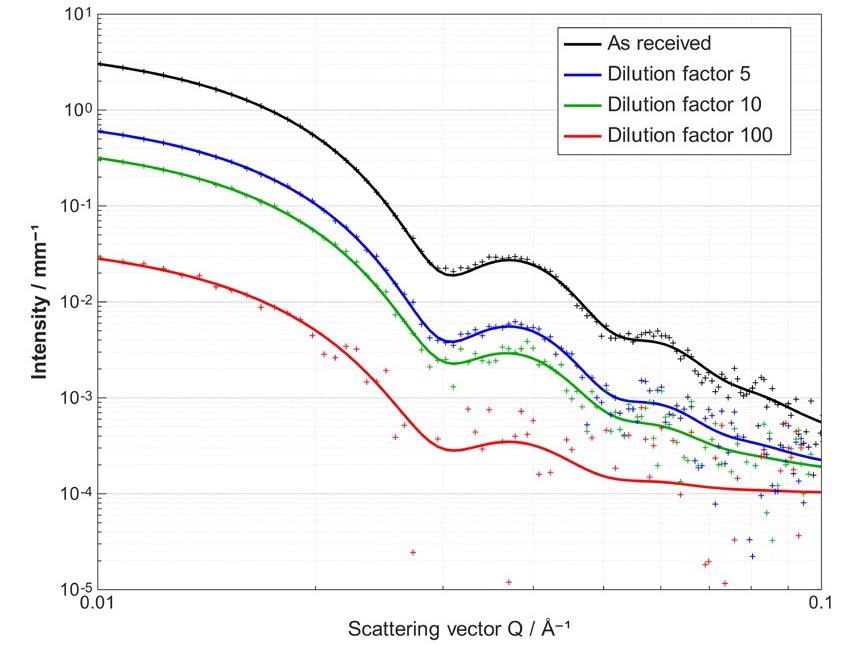
Figure 1. Scattering profiles of the gold NPs after background removal. The symbols correspond to the experimental data and the lines to the fitted model. The higher the concentration, the larger the absolute scattered intensity. Image Credit: Xenocs
To assess the detection limit and linearity of the SAXS method, the as-received dispersion has been diluted 5, 10, 100, and 1000 times.
The height of the profiles directly relates to the sample concentration due to the ability of the Nano-inXider to provide normalized scattering profiles in absolute units. The sample which was most diluted (1000-fold dilution, around 1.5E10E7 particles per mL) did not exhibit enough signal to be included.
The experimental dilution factor (volume of the mother dispersion divided by the total volume after dilution) has been calculated gravimetrically and in comparison with the dilution factor acquired by SAXS (the number concentration of the diluted dispersion divided by the number concentration of the mother dispersion).
As noted in Figure 2, the SAXS concentration is in high agreement with the gravimetric concentration.
The detection limit is estimated to be at 2.5E8 particles per mL from a linear fit of the data points, comparable to a dilution factor of 200 for this specific sample. This detection limit is affected by the instrument performance, the electronic contrast, and the average particle size.
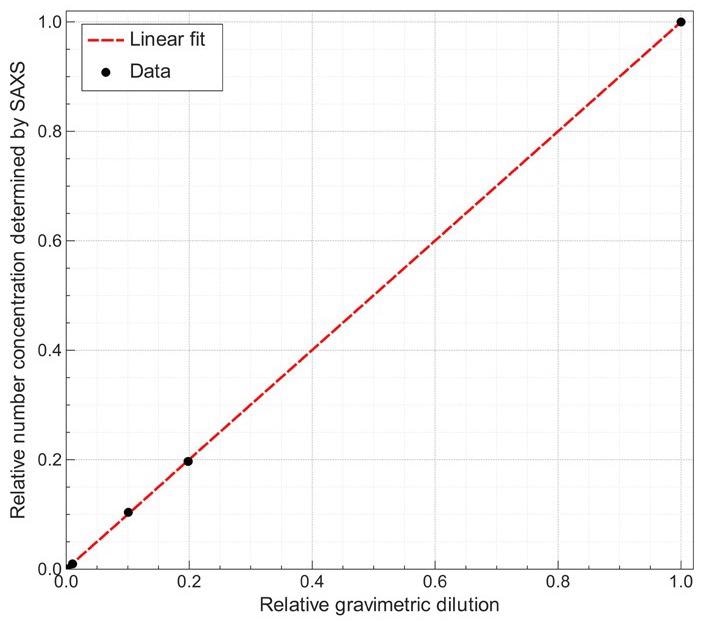
Figure 2. Relative number concentration determined from the SAXS profile as a function of the relative dilution determined gravimetrically when preparing the dilutions. Image Credit: Xenocs
Conclusions
SAXS is an SI-traceable technique for the quantification of both the number concentration and the size distribution of NPs. This article has demonstrated that precise number concentration values can be simply acquired on a laboratory instrument with efficient measurement times.
An ISO standard document is being prepared to outline detailed guidelines for using SAXS to obtain concentration measurements of NPs.
Acknowledgments
The National Physical Laboratory kindly provided the certified gold colloidal dispersions, along with the measurement guidelines and protocols created for the 14IND12 InNanoPart project of the European Metrology Programme for Innovation and Research (EMPIR).
References and Further Reading
- S. Logothetidis, Nanostructured Materials and Their Applications, Springer, 2012.
- G. Gleber, L. Cibik, S. Haas, A. Hoell, P. Müller, and M. Krumrey, “Traceable size determination of PMMA nanoparticles based on Small Angle X-ray Scattering (SAXS),” Journal of Physics: Conference Series, vol. 247, p. 012027, 2010.
- F. Meli, T. Klain, E. Buhr, C. G. Frase, G. Gleber, M. Krumrey, A. Duta, S. Duta, V. Korpelainen and R. Bellotti, “Traceable size determination of nanoparticles, a comparison among European metrology institutes,” Measurement Science and Technology, vol. 23, p. 125005, 2012.
- B. Pauw, C. Kästner and A. Thünemann, “Nanoparticle size distribution quantification: results of a small-angle X-ray scattering inter-laboratory comparison.,” Journal of Applied Crystallography, vol. 50, pp. 1280-1288, 2017.
- A. Schavkan, C. Gollwitzer, R. Garcia-Diez, M. Krumrey, C. Minelli, D. Bartczak, S. Cuello-Nuñez, H. Goenaga-Infante, J. Rissler, E. Sjöström, G. B. Baur, K. Vasilatou and A. Shard, “Number Concentration of Gold Nanoparticles in Suspension: SAXS and spICPMS as Traceable Methods Compared to Laboratory Methods,” Nanomaterials, vol. 9, no. 4, p. 502, 2019.
- “Colloidal gold nanoparticles,” LGC Standards, [Online]. Available: https://www.lgcstandards.com/GB/en/Colloidal-gold-nanoparticles/p/LGCQC5050. [Accessed 16 06 2020].
- EURAMET, “EURAMET Calibration Guide n°18,” 2015. [Online]. Available: https://www.euramet.org/publications-media-centre/calibration-guidelines/.
- “XSACT software: X-ray Scattering Analysis and Calculation Tool,” Xenocs, [Online]. Available: https://www.xenocs.com/saxs-products/xsact-software/.
- J. Pedersen, “Analysis of small-angle scattering data from colloids and polymer so-,” Advances in Colloid and Interface Science, vol. 70, pp. 171-210, 1997.

This information has been sourced, reviewed and adapted from materials provided by Xenocs.
For more information on this source, please visit Xenocs.