Despite the growing importance of obtaining accurate estimates of size, size distribution and concentration of nanoscale particles in an increasingly wide range of applications, existing techniques for obtaining such information (e.g. Electron Microscopy and light scattering) can prove time consuming and complex and results difficult to interpret, particularly in samples which are heterogeneous in composition or which contain a range of particle sizes, e.g. are polydisperse.
Nanoparticle Tracking Analysis (NTA) is a newly developed method for the direct and real-time visualization and analysis of nanoparticles in liquids. Based on a laser illuminated microscopical technique, Brownian motion of nanoparticles is analyzed in real-time by a CCD camera, each particle being simultaneously but separately visualized and tracked by a dedicated particle tracking image analysis programme.
Because each and every particle is visualized and analyzed separately, the resulting estimate of particle size and particle size distribution does not suffer from the limitation of being an intensity weighted, z-average distribution which is normal in conventional ensemble methods of particle sizing in this size regime, e.g. the well established method of Dynamic Light Scattering (DLS) or Photon Correlation Spectroscopy (PCS).
The ability of NTA to simultaneously measure particle size and particle scattering intensity allows heterogeneous particle mixtures to be resolved and, importantly, particle concentration can be estimated directly - the particle size distribution profile obtained by NTA is a direct number/frequency distribution.
Methodology
A finely focussed, 635 nm laser beam is passed through a prism-edged optical flat, the refractive index of which is such that the beam refracts at the interface between the flat and a liquid layer placed above it.
Due to the refraction, the beam compresses to a low profile, intense illumination region in which nanoparticles present in the liquid film can be easily visualised via a long-working distance, x20 magnification microscope objective fitted to an otherwise conventional microscope (Figure 1a). Mounted on a C mount, a CCD camera, operating at 30 frames per second, is used to capture a video field of view approximately 100 um x 80 um.
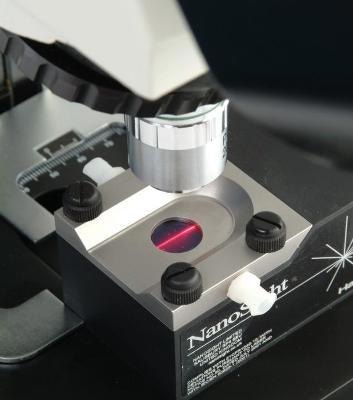
Figure 1a. NanoSight's laser illumination module
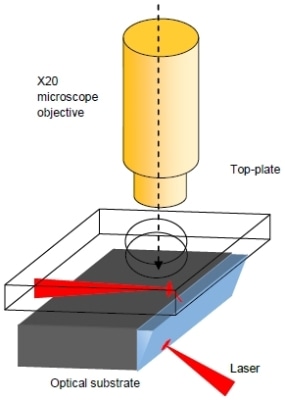
Figure 1b. Schematic showing the optical path of the laser beam and the detection objective viewing the beam through the window.
Particles in the scattering volume are seen moving rapidly under Brownian motion. The NTA programme simultaneously identifies and tracks the centre of each particle on a frame-by-frame basis throughout the length of the video (typically 900 frames or 30 seconds).
Figure 2 shows an enlarged image of two such particles and the trajectory they have taken over several frames as tracked by the NTA image analysis programme.
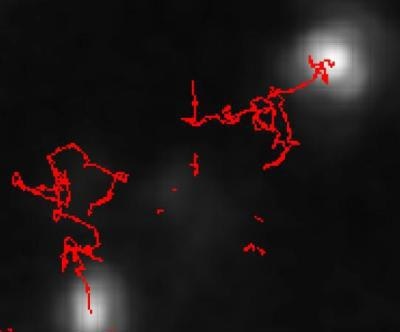
Figure 2. An enlarged image of typical tracks of particles moving under Brownian. Note: the particles are not being imaged, structural information such as shape being below the resolving power of the optical microscope used.
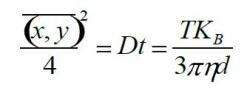
The average distance each particle moves in x and y in the image is automatically calculated. From this value, the particle diffusion coefficient, Dt, can be obtained and, knowing the sample temperature T, and solvent viscosity η, the particle hydrodynamic diameter d identified. That 3 dimensional Brownian movement is tracked only in 2 dimensions (x and y) is accommodated by use of the following variation of the Stokes-Einstein equation (Equation 1);where KB is Boltzmann's constant.
Equation 1:
The range of particle sizes which can be analysed by NTA depends on the particle type. The lower size limit is defined by the particle size and particle refractive index. For very high Ri particles such as colloidal gold, accurate determination of size can be achieved down to 10 nm diameter. For lower refractive index particles, such as those of biological origin, the smallest detectable size might only be between 25-35 nm. This minimum size limit allows, however, the analysis of most types of virus. Upper size limits are approached when the Brownian motion of a particle becomes too limited to track accurately, typically 1-2 µm diameter.
To enable a sufficient number of particles to be analysed within an acceptable time period (e.g. < 60 seconds) from which a statistically meaningful and reproducible particle size distribution profile can be obtained, samples should contain between 107 and 109 particles/ml, dilution of a sample often being required to achieve this concentration.
The benefit of being able to simultaneously measure two independent parameters such as particle scattering intensity and particle diameter (from dynamic behavior) can prove valuable in resolving mixtures of different particle types (e.g. distinguishing between inorganic and polymer particles of the same diameter). Similarly, small differences in particle size within a population can be resolved with far higher accuracy than would be achieved by other ensemble light scattering techniques.
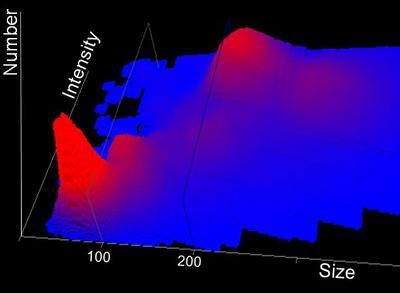
Figure 3. A smoothed 3D plot of size vs. relative light scattered intensity vs.particle number of an aged mixture of 100 nm and 200 nm polystyrene microspheres exhibiting partial aggregation.
Figure 3 shows a partially aggregating sample of a mixture of 100 nm and 200 nm polystyrene microspheres in which the emergence of a peak lying between the two primary populations is indicative of the onset of aggregation or dimerisation.
Applications
Despite only having been developed and made available since 2006, NTA is being increasingly applied in a wide range of different applications and is now being used in over 200 laboratories worldwide (as of October 2009). The following describes some of the areas in which NTA has been applied and results reported.
Nanoparticle Synthesis & Aggregation
The production of nanoparticles by pulsed laser ablation has used NTA (as well as DLS) to determine the particle size distribution in a number of studies. In these, NTA was shown to be better suited to the analysis of polydisperse samples.
In a study of the growth and aggregation of gold nanoparticles monitored by UV-visible absorption, TEM (Transmission Electron Microscopy), DLS and NTA, data from NTA was found to correlate with that obtained by the other techniques and Lundahl used AFM (Atomic Force Microscopy) and SEM (Scanning Electron Microscopy) to follow the synthesis of Ag nanoparticles by citrate reduction.
NTA was used to confirm the monodispersity of the particles and subsequent aggregation on the addition of NaCl. NTA has been successfully used to monitor the size and particle size distribution of copper oxide nanoparticles in organic pollutant degradation and tungsten Carbide-Cobalt nanocomposite powders as new nanoscale materials.
Changes in the formation, dispersion and stability of polymers and polycomplex nanoparticles in both aqueous and solvent system can be followed in real-time using NTA and results compared to other nanoparticle sizing techniques such as turbidimetry, DLS, and TEM.
Comparative assessments of the NTA technique and it's potential as a robust on-line analytical method have also been discussed and an increasing number of studies have compared NTA to conventional methods for the analysis of nanoparticles.
NTA was found to agree well with SEM estimates of average particle size of laser particle sizing of microemulsions formed by ionic hydrocarbon surfactants in supercritical CO2. In a comparative study using flow cytometry, DLS and NTA, Harrison showed that NTA could successfully resolve trimodal distributions of calibration particles where DLS data proved sensitive to contaminants and measurement angle. He found that whilst NTA cannot analyse platelets which are too large, it is suitable for analysing chylomicrons and VLDL particles.
In a comparison of different techniques (AFM, SEM, TEM, optical microscopy, DLS, NTA, resonant Raman spectroscopy and absorption spectroscopy) for characterising carbon nanotube-thermotropic nematic liquid crystal composites, it was concluded that NTA, DLS, AFM and optical microscopy were most suitable. In a study of the assembly of binary microgel thin films, NTA was used to confirm solution diffusion coefficients.
Nanoparticle Toxicity & Effects on Biological Systems
In the study of nanoparticle toxicity, NTA has proved useful in being able to determine the degree to which suspensions of nanoparticles are dispersed prior to studying their effect on biological systems. Similarly, NTA was applied to measure the particle size distribution of nanoparticle aggregates when investigating free radical generation by nanoparticles using dithiothreitol as an indicator.
DLS and NTA were used to investigate the effect of a biological medium on the particle size of 60 nm gold nanoparticles. Results from NTA were in agreement with those of DLS in showing the mean particle size increased by 10 nm and NTA also showed that the breadth (polydispersity) of the distribution was in agreement with measurements made by other techniques.
Similarly, the effect on the aggregation of titanium dioxide nanoparticles by natural aquatic media was studied using DLS and NTA. NTA was found to generate more accurate data from polydispersed sample types though results depended on experimental conditions.
In the study of wear debris from metal-on-metal implant and prostheses, NTA was used to show, for the first time, that significantly higher concentrations of <0.5 um particles were present than were expected while another group showed that coatings designed to reduce wear on prosthesis surfaces can be detrimental under certain circumstance.
As NTA is capable of simultaneously tracking particles on an individual basis, more than one parameter can be measured for each particle.
While the dynamic Brownian motion activity is analysed to determine particle size, it is possible to simultaneously measure the relative, average intensity of light scattered from each particle. This allows similar sized particles of different refractive index particles to be discriminated. Accordingly, NTA's ability to plot particle size as a function of refractive index was used to demonstrate the preparation of well-defined metallised tobacco mosaic virus (TMV) nanorods in high yields and with uniform coatings.
Drug Delivery & Nanoencapsulation
NTA has been used to analyse changes over 1 hour timescales in filtered preparations of nanocapsules into which had been incorporated a P-glycoprotein (P-gp) substrate drug, tacrolimus, as a novel form of a double coated controlled release formulation.
It has been shown that NTA can distinguish between two types of thiol nanoparticles in a mixture, one of which was found to have entrapped ß-galactosidase enzymes and was correspondingly much larger in size (300 nm diameter) than the smaller particles which contained no enzyme (similarly identified as being 150 nm diameter as measured by NTA and Photon Correlation Spectroscopy). The bimodal nature of the mixture identified by NTA was confirmed by field emission gun scanning electron microscopy (FEGSEM) and allowed the application of a sucrose gradient separation step technique to separate the two particle types.
Successful separation was confirmed by both NTA and colorimetric assay showing NTA could be used directly in optimising the isolation of these complex particle mixtures for subsequent possible application in a wide range of processes and devices which require catalytic functionalised surfaces, such as biosensors and biocatalytic reactors.
In a study of the effect of increasing the chain length over C-18 and varying the oxidation level in synthesised N4,N9-diacyl spermines on DNA and siRNA formulation NTA and ethidium bromide fluorescence quenching were used to determine the abilities of these novel compounds to condense DNA and to form nanoparticles.
Successful characterisation by these techniques identified efficient pEGFP and siRNA formulation and delivery to primary skin and cancer cell lines. Similarly, a RiboGreen intercalation assay and NTA particle sizing were used to determine the effect of sequentially changing the chain length, oxidation level, and charge distribution in N4,N9-diacyl and N4,N9-dialkyl spermines on their ability to bind to siRNA and form nanoparticles.
In another study bispecific anticancer and antiangiogenic polymer-alendronate-taxane conjugates being developed to target bone metastases were confirmed as being 95 nm mean as sized by NTA.
Vaccine Production
A comparison of emerging analytical techniques to characterize a 40 nm diameter viral vaccine for both research and production applications has recently been carried out in which NTA was compared with more established techniques such as TEM (Transmission Electron Microscope), DLS (Dynamic Light Scattering), Static Light Scattering, Size Exclusion - Multi Angle Light Scattering (SEC-MALS), Asymmetric Flow - (Field Flow Fractionation in combination with SLS and Analytical Ultra Centrifugation).
While each technique was considered to have both strengths and weaknesses as analytical methods in this application (see Table 1 below) only NTA was shown to be accurate at both the reference standard and high concentration sample types giving a primary particle diameter of 40 nm for each, whereas DLS and SEC-MALS (the only two techniques capable of working at both concentrations) gave 42 nm and 68 nm (SEC-MALS) and 56 nm and 66 nm (DLS) for the 40 nm virus particle.
Table 1. NTA comparison to traditional methodologies for particle characterisation.
|
Technique
|
Strengths
|
Weaknesses
|
|
TEM
|
Visualisation of virus
|
High costs
Complex sample preparation procedure
|
|
Dynamic Light Scattering (DLS)
|
Fast results-high sample throughput
Direct sample measurement-no dilution on column
|
Complex data evaluation
Not a quantitative method
Poor for complex, polydisperse sample
types (e.g. many biological sample types)
|
|
Static Light Scattering (SLS)
|
Approved, reliable method-qualifiable
Minimum sample preparation necessary
Analysis of low concentration samples
|
Medium costs, trained operators, high
standard of equipment maintenance
Sample diluted in mobile phase
Possible interaction between stationary phase and sample
|
|
Asymmetric Field Flow
Fractionation
|
No interaction between column stationary phase and sample
Analysis of low concentration samples
|
Medium costs, trained operators, high standard of equipment maintenance
Sample diluted in mobile phase
|
|
Analytical Ultra Centrifugation
|
High resolution
Accurate native molecular weight to support SEC methods thus very useful for proteins
|
High cost
Complex sample preperation & data evaluation
Low sample throughput
|
|
NTA
|
Low costs - easy to use
Fast results - high sample throughput
Analysis of low concentration samples-small sample volume
|
Sample dilution necessary
New method - limited experience to rely on
|
Figures 2a and 2b show two dilutions of the sample, Figure 2a being the more dilute sample which accordingly contains a lower concentration of aggregates. Figure 2b shows the higher concentration sample in which the correspondingly higher numbers of aggregates can be clearly distinguished but which do not affect the accuracy of analysis of the primary 40 nm particle.
Note also the y-axis scale which gives different particle concentrations (higher for sample b) showing the significant particle counting advantage of NTA over DLS which cannot generate such data. Also shown are the cumulative undersize plots for each distribution.
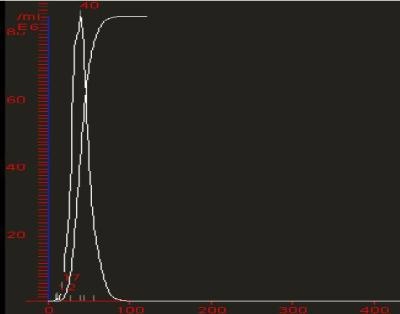
Figure 2a. Low concentration of a 40 nm virus preparation.
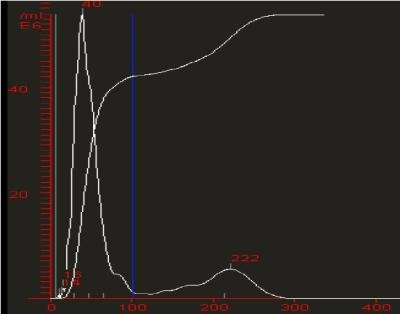
Figure 2b. Higher concentration of the same material showing presence of aggregates and lower primary particle concentrations.
A further example of the insensitivity of NTA to the presence of aggregates in a sample is clearly shown in the following example. Another sample of the virus described above was measured by NTA at 45 nm diameter (Figure 3a).
However, following agitation of the same sample by simple shaking for a few seconds, shear stress was seen to have induced aggregation in the virus sample (Figure 3b).
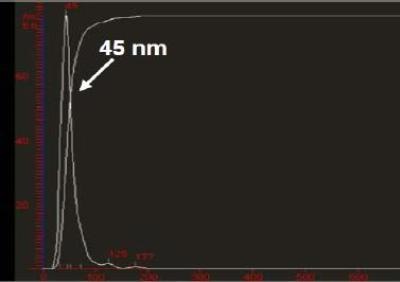
Figure 3a. Particle Size/Concentration.
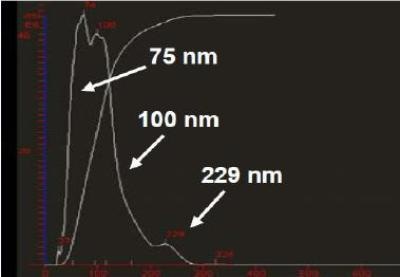
Figure 3b. Particle Size/Concentration.
Particle size distribution profile of a virus sample a) before and b) after shear stress induced aggregation. Note the change in scale of the normalized vertical axis shows a drop in the concentration of particles on aggregation (from approximately 80x10^6 particles/ml to approximately 50 x 10^6 particles/ml). Such information is unavailable to other ensemble light scattering techniques such as DLS.
Conclusion
NTA is a direct and fast technique by which nanoparticles in their natural solvated state in a liquid can be rapidly detected, sized and counted. While limited to particles of 10-20 nm, and above and to concentration ranges between 107 - 109 particles per ml, the ability to simultaneously visualize and analyze nanoparticles on an individual basis allows for much improved resolution of polydisperse and/or heterogeneous sample types.
The technique can be used to complement existing techniques for the sizing of nanoparticles (e.g. DLS, PCS) allowing data obtained from these methods to be validated by direct microscopical observations of the sample. Table 2 above page summarizes the applications and samples types to which NTA has been applied to date.

This information has been sourced, reviewed and adapted from materials provided by Malvern Panalytical.
For more information please visit Malvern Panalytical.