Nanoparticle Tracking Analysis, or NTA, is a technique used for measuring and analyzing single particle size and concentration. The increasing use of this method has driven the need to reduce variability and user input and offer inter-laboratory consistency in terms of concentration and size measurements. In order to obtain highly precise, accurate, and reproducible concentration measurements on different types of nanoparticles, the NTA concentration measurement has been altered considerably. Repeatability and reproducibility of concentration measurements have been increased significantly, while eliminating measurement sensitivity to user settings over the suggested concentration range for NTA analysis.
Overview of Nanoparticle Tracking Analysis
To acquire the particle size distribution of samples in liquid suspension, the NTA technique uses the properties of Brownian motion and light scattering. When a laser beam is passed through the sample chamber, the particles in suspension that fall in the laser beam path disperse light in such a way that they can be observed through a 20x magnification microscope. A camera mounted on this microscope records a video file of the movement of the particles under Brownian motion, within its field of view (Figure 1).
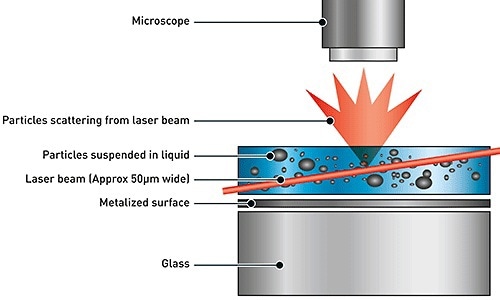
Figure 1. Schematic of the optical configuration used in NTA.
The particles’ movement is recorded on a frame-by-frame basis. At the same time, the NTA software detects and monitors the center of individual particles that were observed, and also measures the standard distance moved by individual particles in the direction of x and y planes. The value thus obtained makes it possible to determine the particle diffusion coefficient (Dt). From this, if the solvent viscosity η and sample temperature T are known, it is possible to identify the sphere-equivalent hydrodynamic diameter (d) of the particles using the following Stokes-Einstein equation:
where KB is Boltzmann's constant.
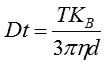
The NTA method sizes each particle individually, regardless of the others. Figure 2 shows an example of the size distribution profile produced by NTA. Moreover, since NTA is capable of determining on a particle-by-particle basis, the number of particles that come within the camera’s field of view is known. A fixed field of view of about 100 x 80 µm, illuminated by a beam of 10 µm in depth, is used in standard NTA measurements, making it possible to estimate the sample’s scattering volume. The latest upgrade of NTA concentration measurement provides repeatable and accurate concentration values by mitigating the effect of capture and analysis settings on the concentration results.
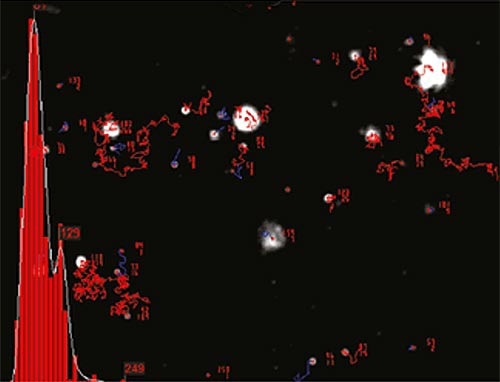
Figure 2. An example of the size distribution profile generated by NTA. The modal size for this sample is found to be approximately 70 nm, with larger sized particles also present.
Results and Discussion
The precision of concentration measurement increases considerably when the NTA concentration measurement upgrade is used as shown in Figure 3.
Figure 3. Inter-laboratory precision on a range of sample types and concentrations before and after the NTA Concentration Measurement Upgrade.
At user-defined settings, similar samples were examined on two different NS500 devices at two different laboratories. Prior to applying the NTA concentration measurement upgrade, results obtained from both laboratories differed considerably, particularly at higher levels of concentration. However, once the upgrade was used, the reproducibility between the two laboratories enhanced significantly. Also, the precision of sample concentration measurement improved considerably.
When the NTA syringe pump was used, the difference between measurements was reduced significantly, and both sizing and concentration repeatability were improved to a large extent. Figure 4 illustrates an example of the enhancements observed when the NTA syringe pump was used. Here, a 100 nm sample of polystyrene standards was examined using flow (with syringe pump) or static (no syringe pump) measurements at the same capture and analysis settings.
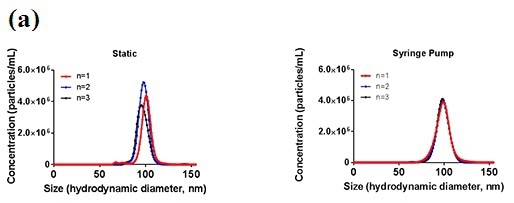
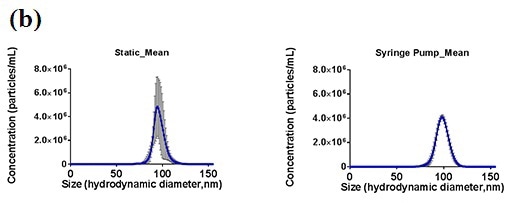
Figure 4. Improvements in sizing and concentration measurement repeatability when using the NTA syringe pump, compared to static measurements, in conjunction with the NTA concentration measurement upgrade. Samples (100 nm polystyrene standards) were analyzed as 5 x 60 second videos at the same camera levels and detection thresholds with 3 repeats being compared (a). The variation between 5 individual 60 second measurement is shown for static and flow conditions (b).
The development of a protocol for sample delivery and measurement has been shown to improve accuracy. These integrand steps give repeatability values down to 3% (cv). Dilution linearity measurements can give precise results with just an error of 13% over a concentration range of 1x10⁶ - 1x10⁹ particles per ml, depending on refractive index and particle size.
The NTA concentration measurement upgrade helps in reducing the sensitivity of the concentration measurement to user settings, i.e., detection and camera level threshold (Figure 5). Samples that were captured at different levels of camera were examined across an array of detection thresholds. Prior to using the NTA concentration measurement upgrade, concentration results differed considerably with the selected detection threshold, but after applying the upgrade, the results were similar over the range of detection thresholds analyzed.
Results, which were obtained at different levels of camera but assessed at the same detection threshold, again revealed a difference in concentration prior to applying the NTA concentration measurement upgrade; however, this difference is significantly reduced when the upgrade was applied.
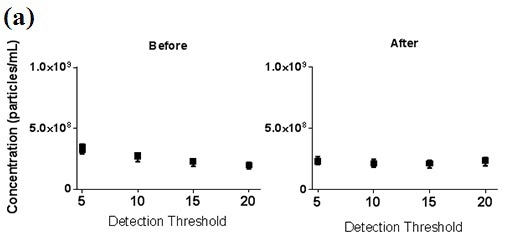
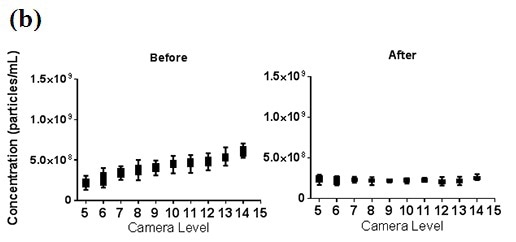
Figure 5. Concentration data showing the influence of camera level and detection threshold setting before and after Concentration Measurement Upgrade. a) 100nm PSL sample recorded at a single camera level then analysed at different detection thresholds and b) 100nm PSL sample recorded at varying camera levels and analysed at a single detection threshold.
Although the overall particle concentration differed (Figure 5) due to user settings prior to applying the upgrade, the total distribution also demonstrated a minimal difference when the upgrade was applied (Figure 6). This reduction has been observed across a range of materials, particle sizes and concentrations.
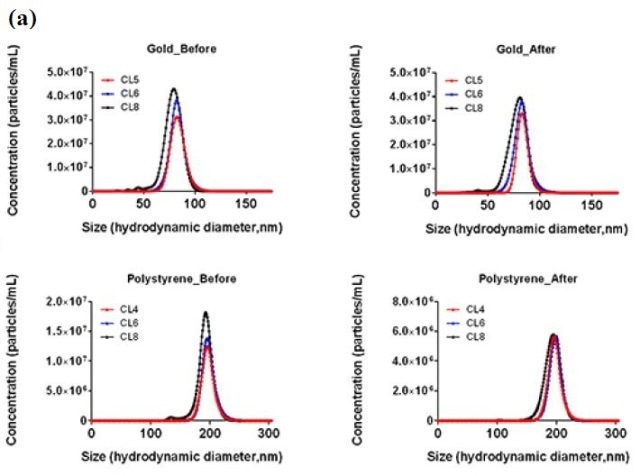
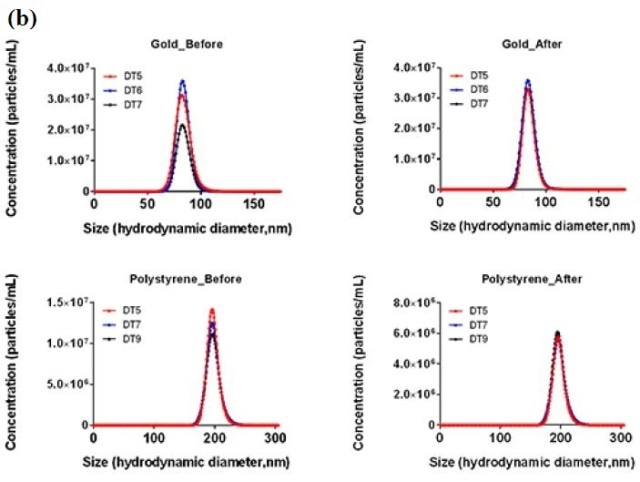
Figure 6. Influence of user settings on NTA concentration measurements and distributions, with and without the NTA concentration measurement upgrade applied, over a range of (a) camera levels and (b) detection thresholds for both 80nm gold and 200nm polystyrene particles.
Over the past few years, research on extracellular vesicles has attracted significant interest because they are present in a wide range of eukaryotic and prokaryotic organisms. These vesicles are known to play a major role in many pathological and physiological processes and are often referred to as microvesicles that are created by cell membrane budding, or exosomes that are generated from the cell endosome. The structure, cellular origin, characterization and functions of these microvesicles are a topic of much debate. The research community is also debating the size of these vesicles, despite the fact that exosomes are known to be smaller in size which is often 100nm in diameter or less, whereas microvesicles are larger with a diameter of up to 1µm.
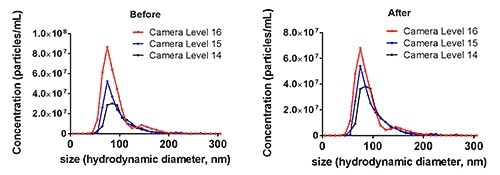
Figure 7. Exosome concentration data showing improved accuracy and precision after the NTA Concentration Measurement Upgrade at three different camera levels.
On non-standard samples such as microvesicles and exosomes (Figure 7), the application of the NTA concentration measurement upgrade has been shown to enhance the precision and accuracy of concentration measurements. In this example, different users opted for 14, 15 or 16 camera level. Upon applying the upgrade, the measurement repeatability at different levels of camera was increased, while setting induced variations were reduced considerably.
Conclusion
The application of NTA concentration measurement upgrade enhances both the precision and accuracy of concentration measurements across a broad range of materials, sample sizes, and concentrations. In particular, the application of the upgrade significantly improved the inter- and intra- laboratory reproducibility and repeatability.
The upgrade also reduces the effect of user-defined capture and analysis settings on measurements. Moreover, the use of a NTA syringe pump improves the precision, accuracy, and repeatability of both concentration and size measurement. The application of upgrade is also useful in the concentration measurements of microvesicles, exosomes and other and non-standard types of samples.

This information has been sourced, reviewed and adapted from materials provided by Malvern Panalytical.
For more information please visit Malvern Panalytical.