The thermal conductivity of nanofluids is an important characteristic of heat transfer. Nanofluids are fluids composed of a base fluid and nano-sized particles (1–100 nm) floating in them.
Image Credit: FabrikaSimf/Shutterstock.com
Carbon-based nanomaterials, such as carbon nanotubes, graphite nanoparticles, and flaking graphite nanofibers, have been shown to be effective substrates for forming hybrid nanofluids in several investigations.
Graphene and its oxides have high thermal conductivity, making them ideal for use in nanofluids to improve heat transmission. Graphene oxide nanofluids are one of the most promising nanofluids under investigation, and accurate and trustworthy correlations for predicting their thermophysical characteristics are still needed, even though numerous correlations are currently accessible in the literature.
On the other hand, several numerical studies on the flow and heat transfer properties of various types of nanofluids are critical for a thorough knowledge and prediction of nanofluid performance in practice.
Research published in the MDPI journal applied sciences details the impact of varying factors on the heat transfer performance of graphene oxide nanofluids, describing a theoretical and experimental correlation for the exact prediction of such nanofluids’ thermal conductivity.
To begin, five different graphene oxide nanofluids were made, each with a mass fraction ranging from 0.002% to 0.010% at the same concentration gradient. Stability, thermal conductivity, and dynamic viscosity were then measured.
Methodology
Graphene oxide nanopowders (GO) with a purity of 99.99% were utilized as dispersing particles (Figure 1), with sodium dodecyl sulfate as a dispersant and deionized water as a dispersion.
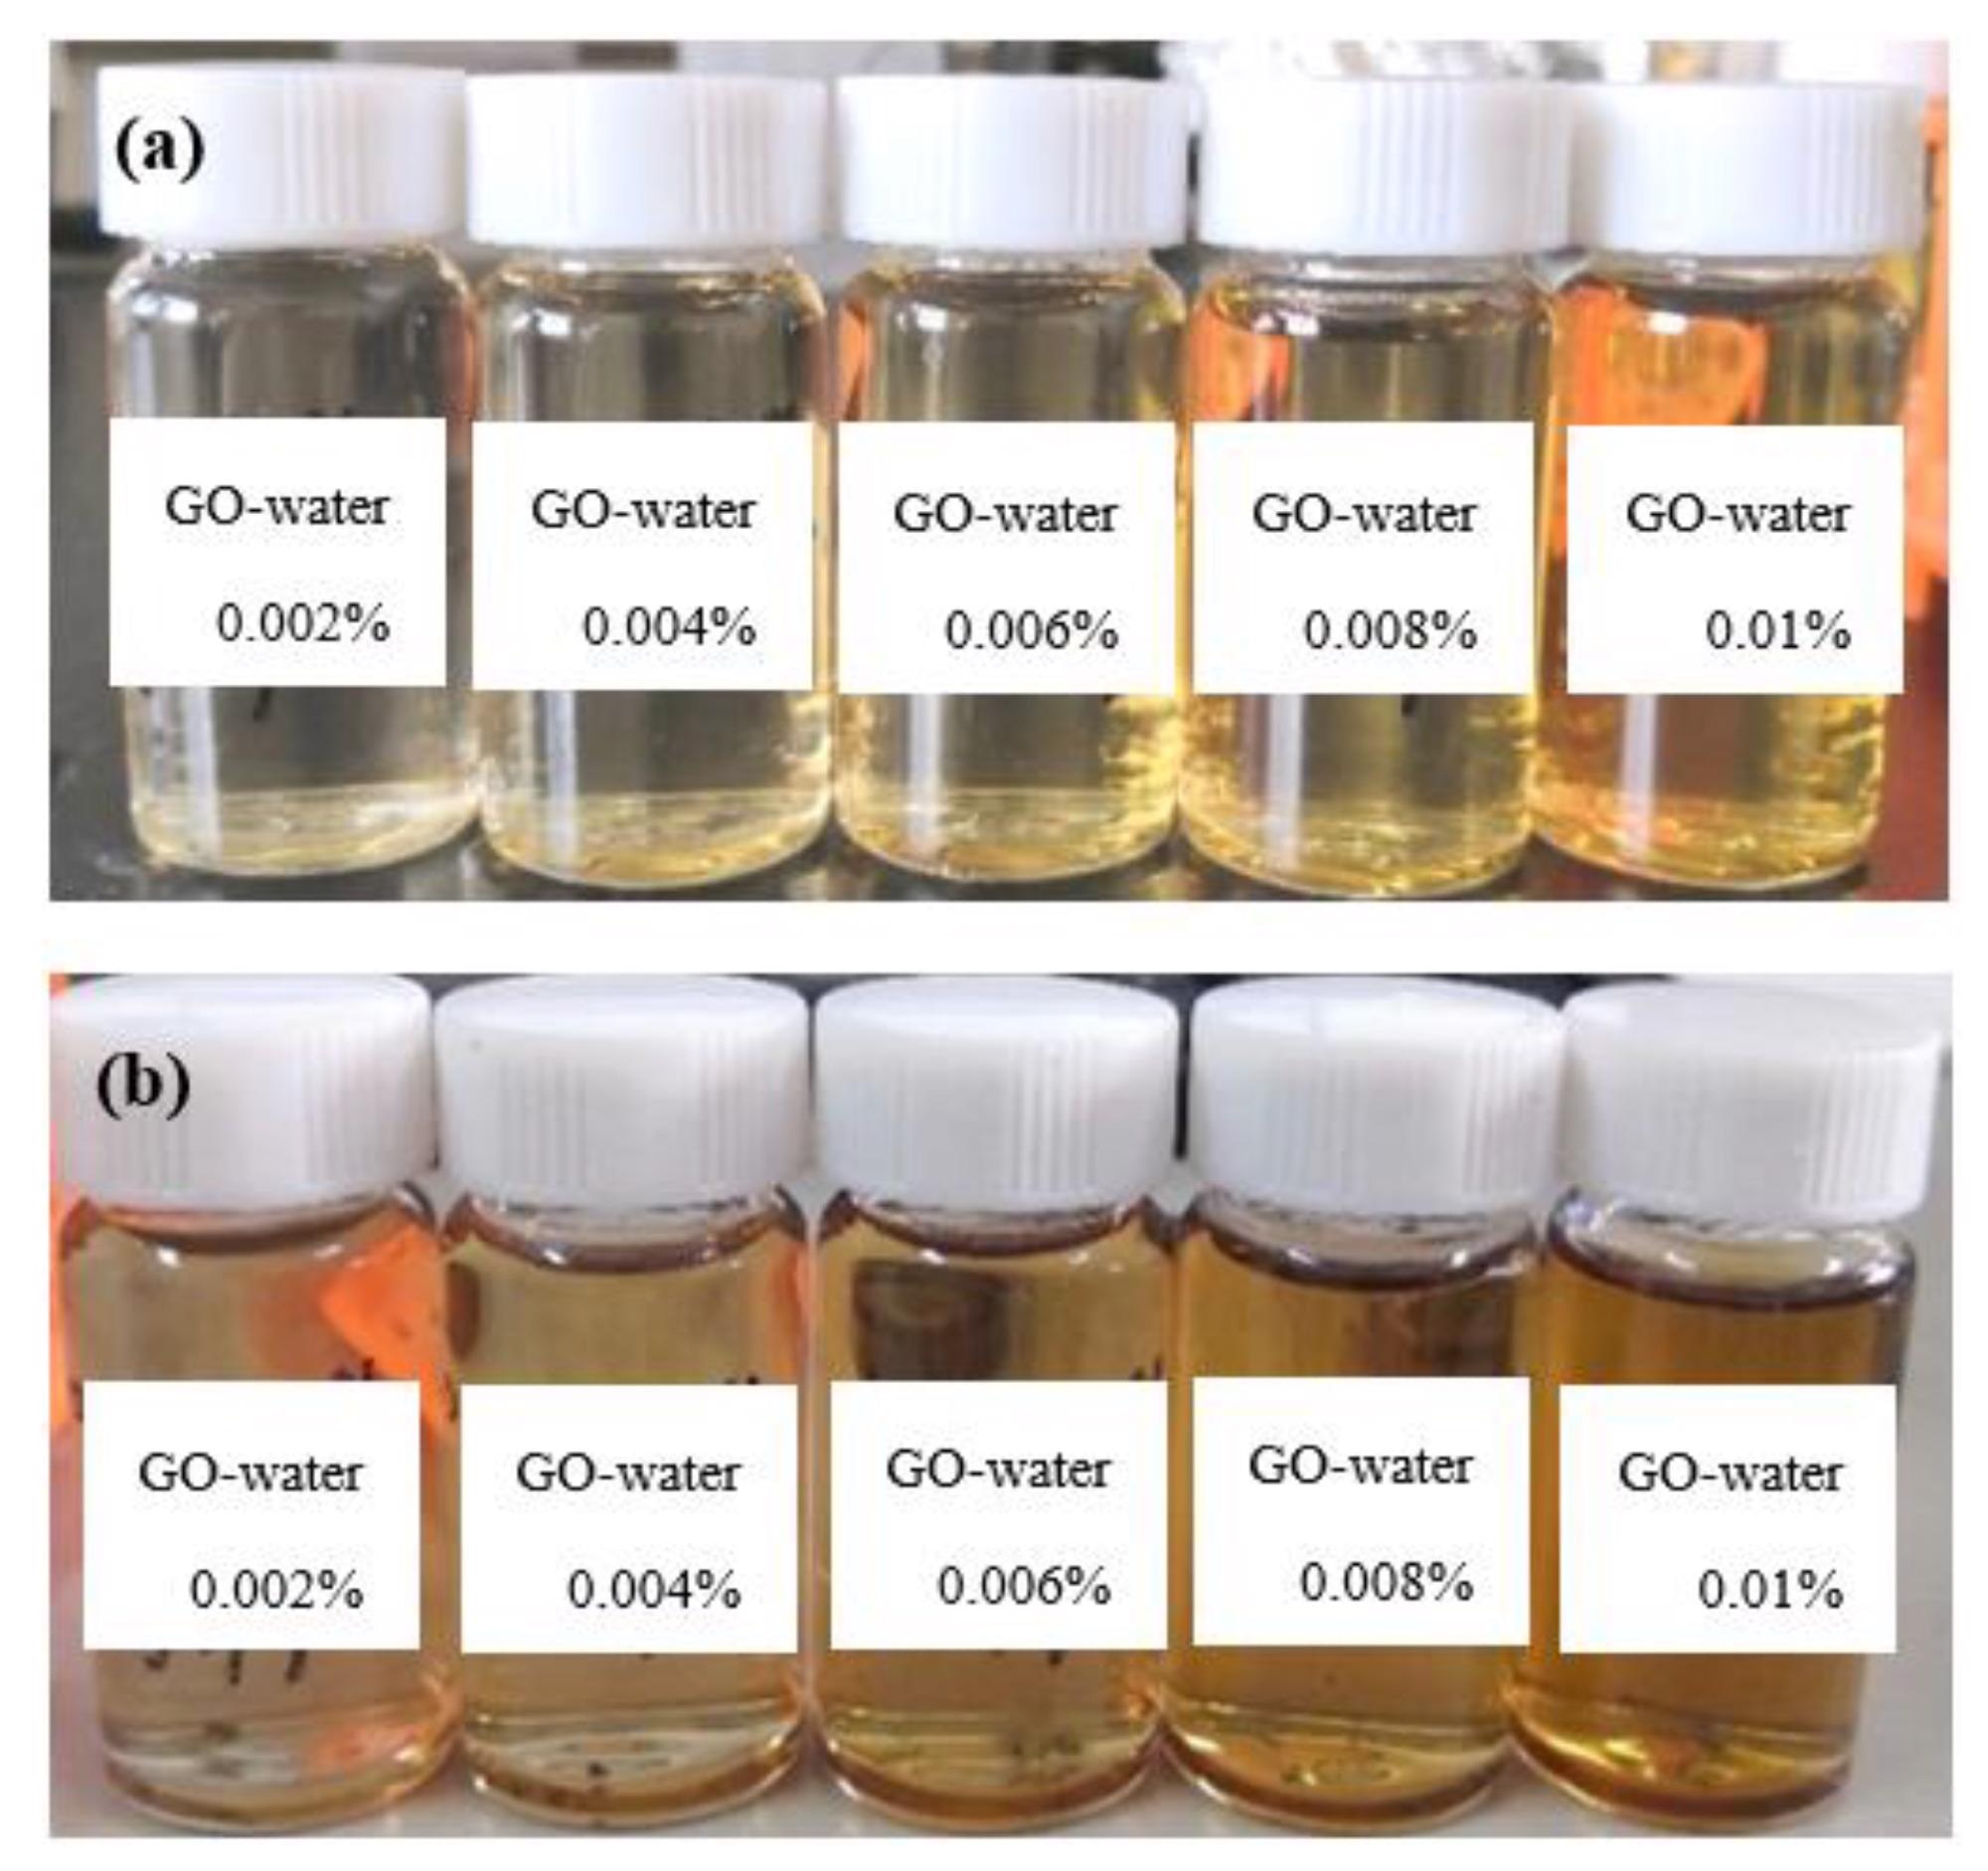
Figure 1. Nanofluids with different concentrations (a): 0 d and (b): 20 d. Image Credit: Mei, et al., 2022
A two-step approach was used to make graphene oxide nanofluids in this investigation. After adding nanoparticles to deionized water, magnetic stirring and ultrasonication (both for 1 hour) were utilized to create five different concentrations of graphene oxide nanofluids. With a mass fraction of 0.002–0.01%, five types of graphene oxide nanofluids were created.
To determine how stable the nanofluids were, researchers compared newly prepared nanofluids to nanofluids that had been standing for 20 days.
A Zeta potential meter was used to determine the samples’ Zeta potential (ξ) (ZS, Malvern Instruments, Worcestershire, UK). The temperatures of the samples were monitored at intervals of 10 °C between 30–70 °C. At room temperature, transmission spectra of each sample were measured using a double-beam UV–Vis–NIR spectrophotometer (Agilent Cary 5000) using a quartz cuvette with an optical path length of 10 mm in the wavelength range 200–800 nm.
The thermal conductivity of the specimen was analyzed using a laser thermal conductivity analyzer at temperatures ranging from 20–50 °C at 10 °C intervals (LFA 467, NETZSCH, and Selb, Germany). A high-pressure rheometer was used to assess the rheological characteristics (MCR302, Anton Paar, Ashland, VA, USA).
Results
Researchers measured the light absorptivity of nanofluids at various wavelengths using a UV-visible absorption spectrometer, as shown in Figure 2(a). The maximum absorptivity of the GO nanofluids at different concentrations was subsequently measured and plotted against the nanoparticle mass concentration, as shown in Figure 2(b). The maximum absorption and mass fraction of nanofluid has a strong linear relationship, as illustrated.
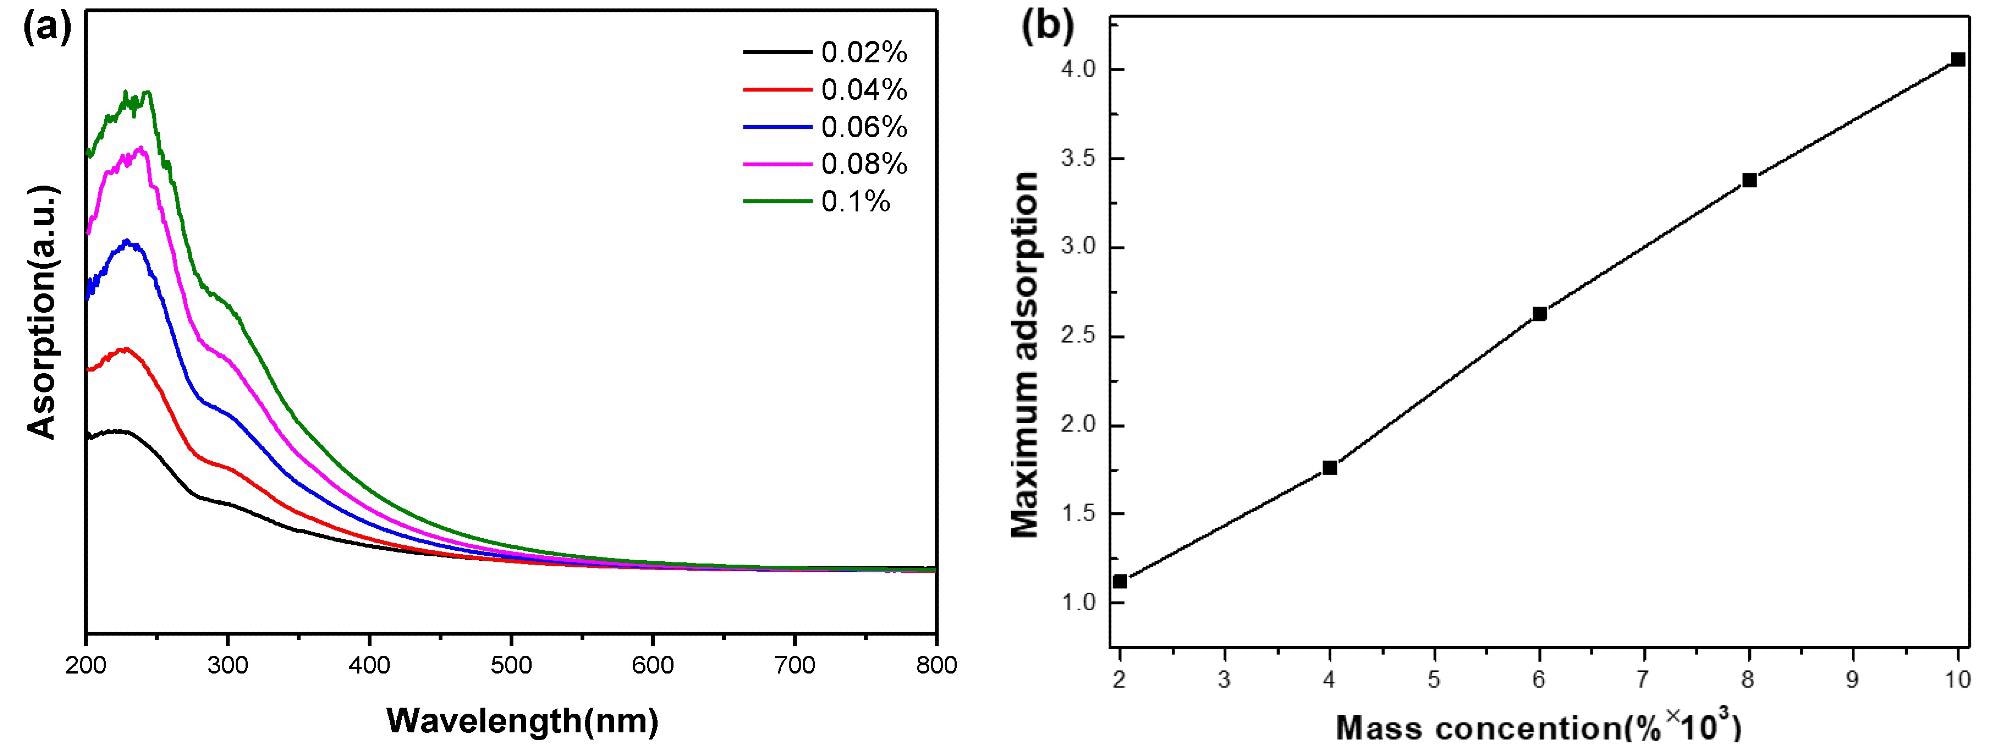
Figure 2. (a) UV–Vis absorption spectra of GO nanofluids with different concentrations and (b) relationship between mass concentration and maximum absorption. Image Credit: Mei, et al., 2022
A Zeta potential analyzer was used to examine the zeta potential and particle sizes of nanofluids with a mass fraction of 0.002%. Figure 3 depicts the outcomes.
Figure 3(a) shows that the absolute value of the zeta potential corresponding to the peak value is 45.3 mv, indicating that nanofluids are relatively stable. The particle size correlating to the intensity peak is on hundreds of nanometers, as seen in Figure 3(b)'s particle size distribution curve.
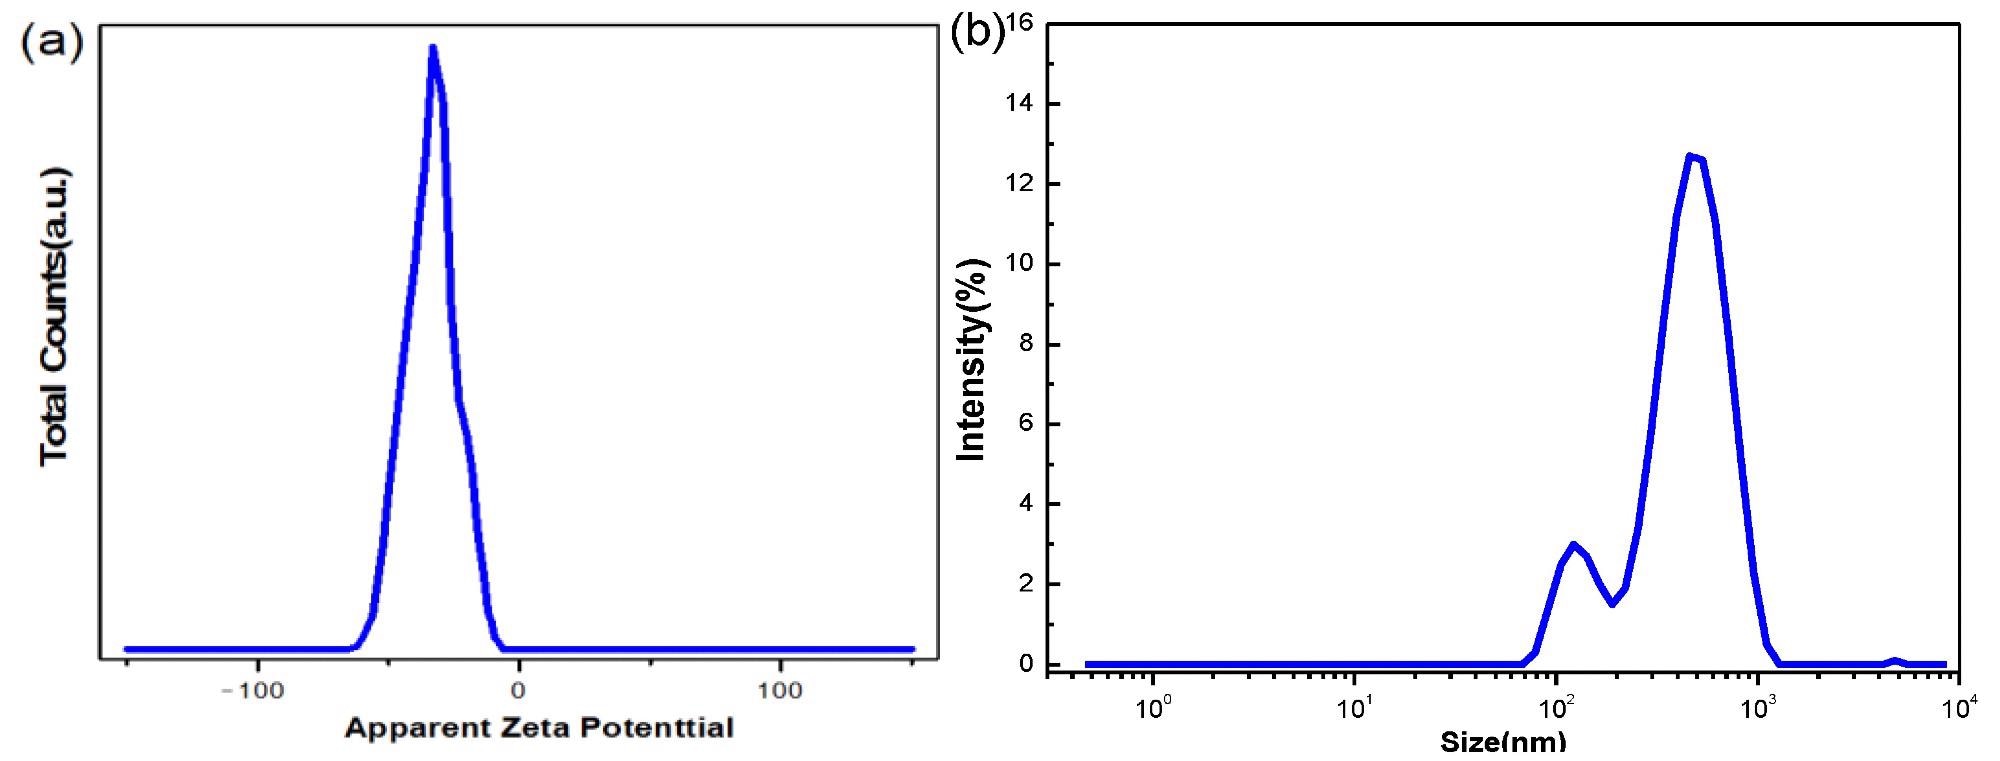
Figure 3. (a) Zeta potential of 0.002% GO nanofluid and (b) particle size distribution intensity curve of 0.002% GO nanofluid. Image Credit: Mei, et al., 2022
Figure 4(a–e) illustrates the dynamic viscosity variations of nanofluids with various mass concentrations when the shear rate is changed from 0 to 100/second in the temperature range of 25 - 45 °C. The link between temperature and dynamic viscosity is seen in Figure 4(f).
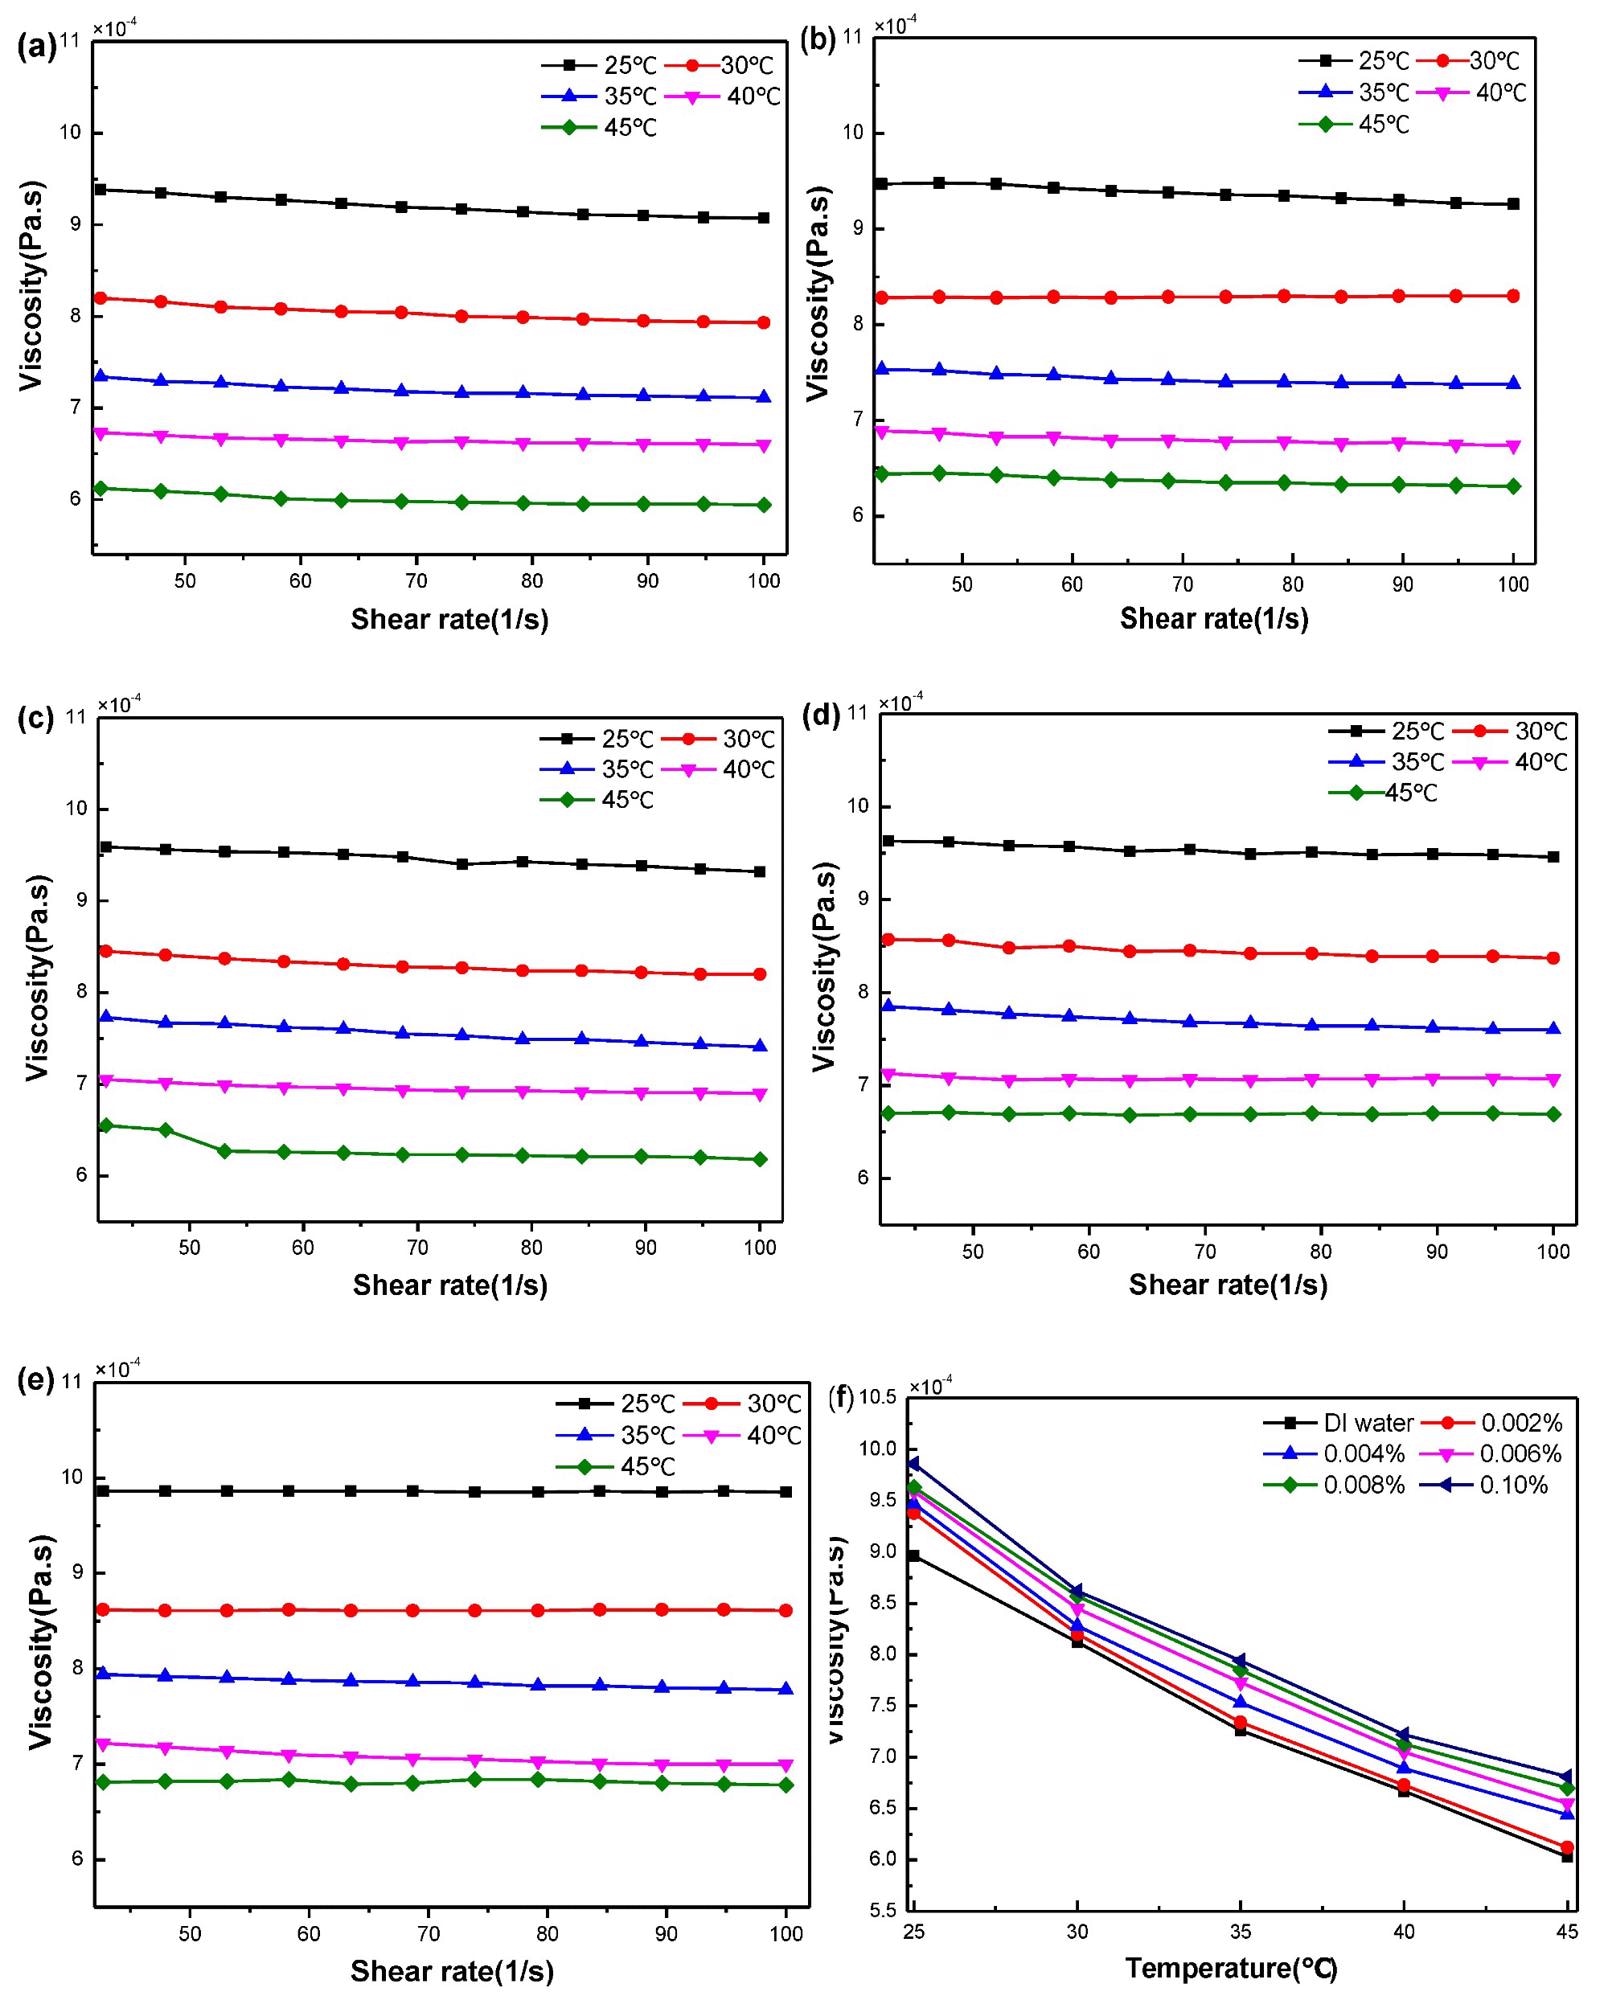
Figure 4. Relationship between viscosity and shear rate of nanofluids (a–e) GO–water 0.002%, 0.004% 0.006%, 0.008% and 0.010% and (f) relationship between temperature and dynamic viscosity. Image Credit: Mei, et al., 2022
Under varying nanoparticle concentrations, Figure 5 depicts the connection between relative conductivity and temperature.
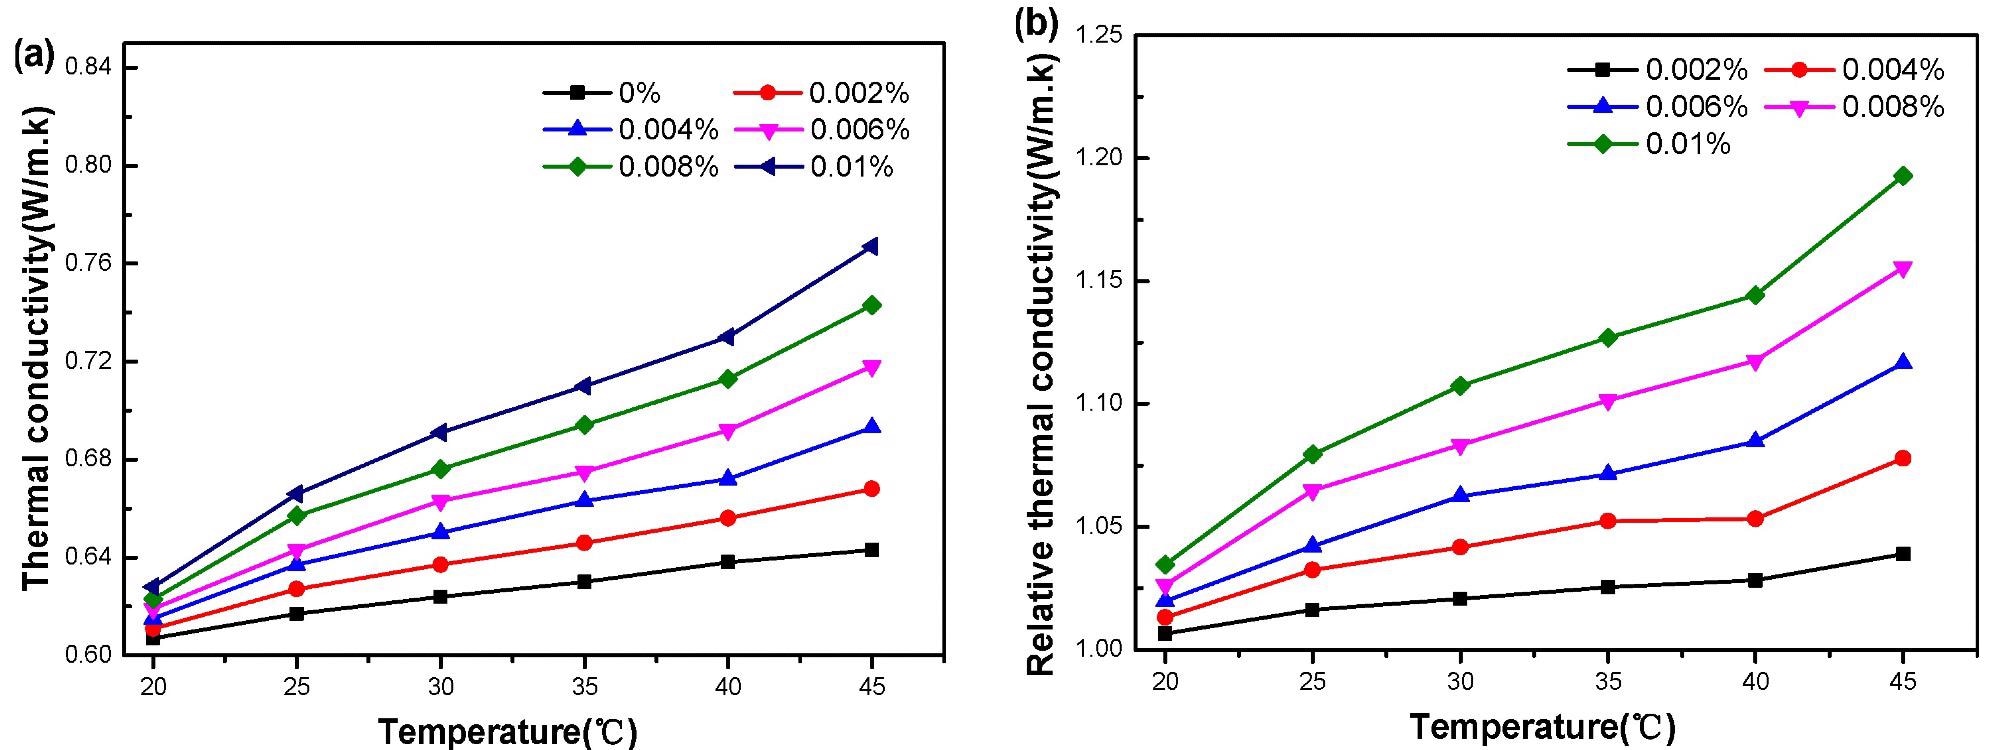
Figure 5. Thermal conductivity of GO–water nanofluid versus temperature. (a): absolute, (b): relative to water. Image Credit: Mei, et al., 2022
The thermal conductivity increases of water-based GO nanofluids as a function of particle mass fractions are shown in Figure 6.
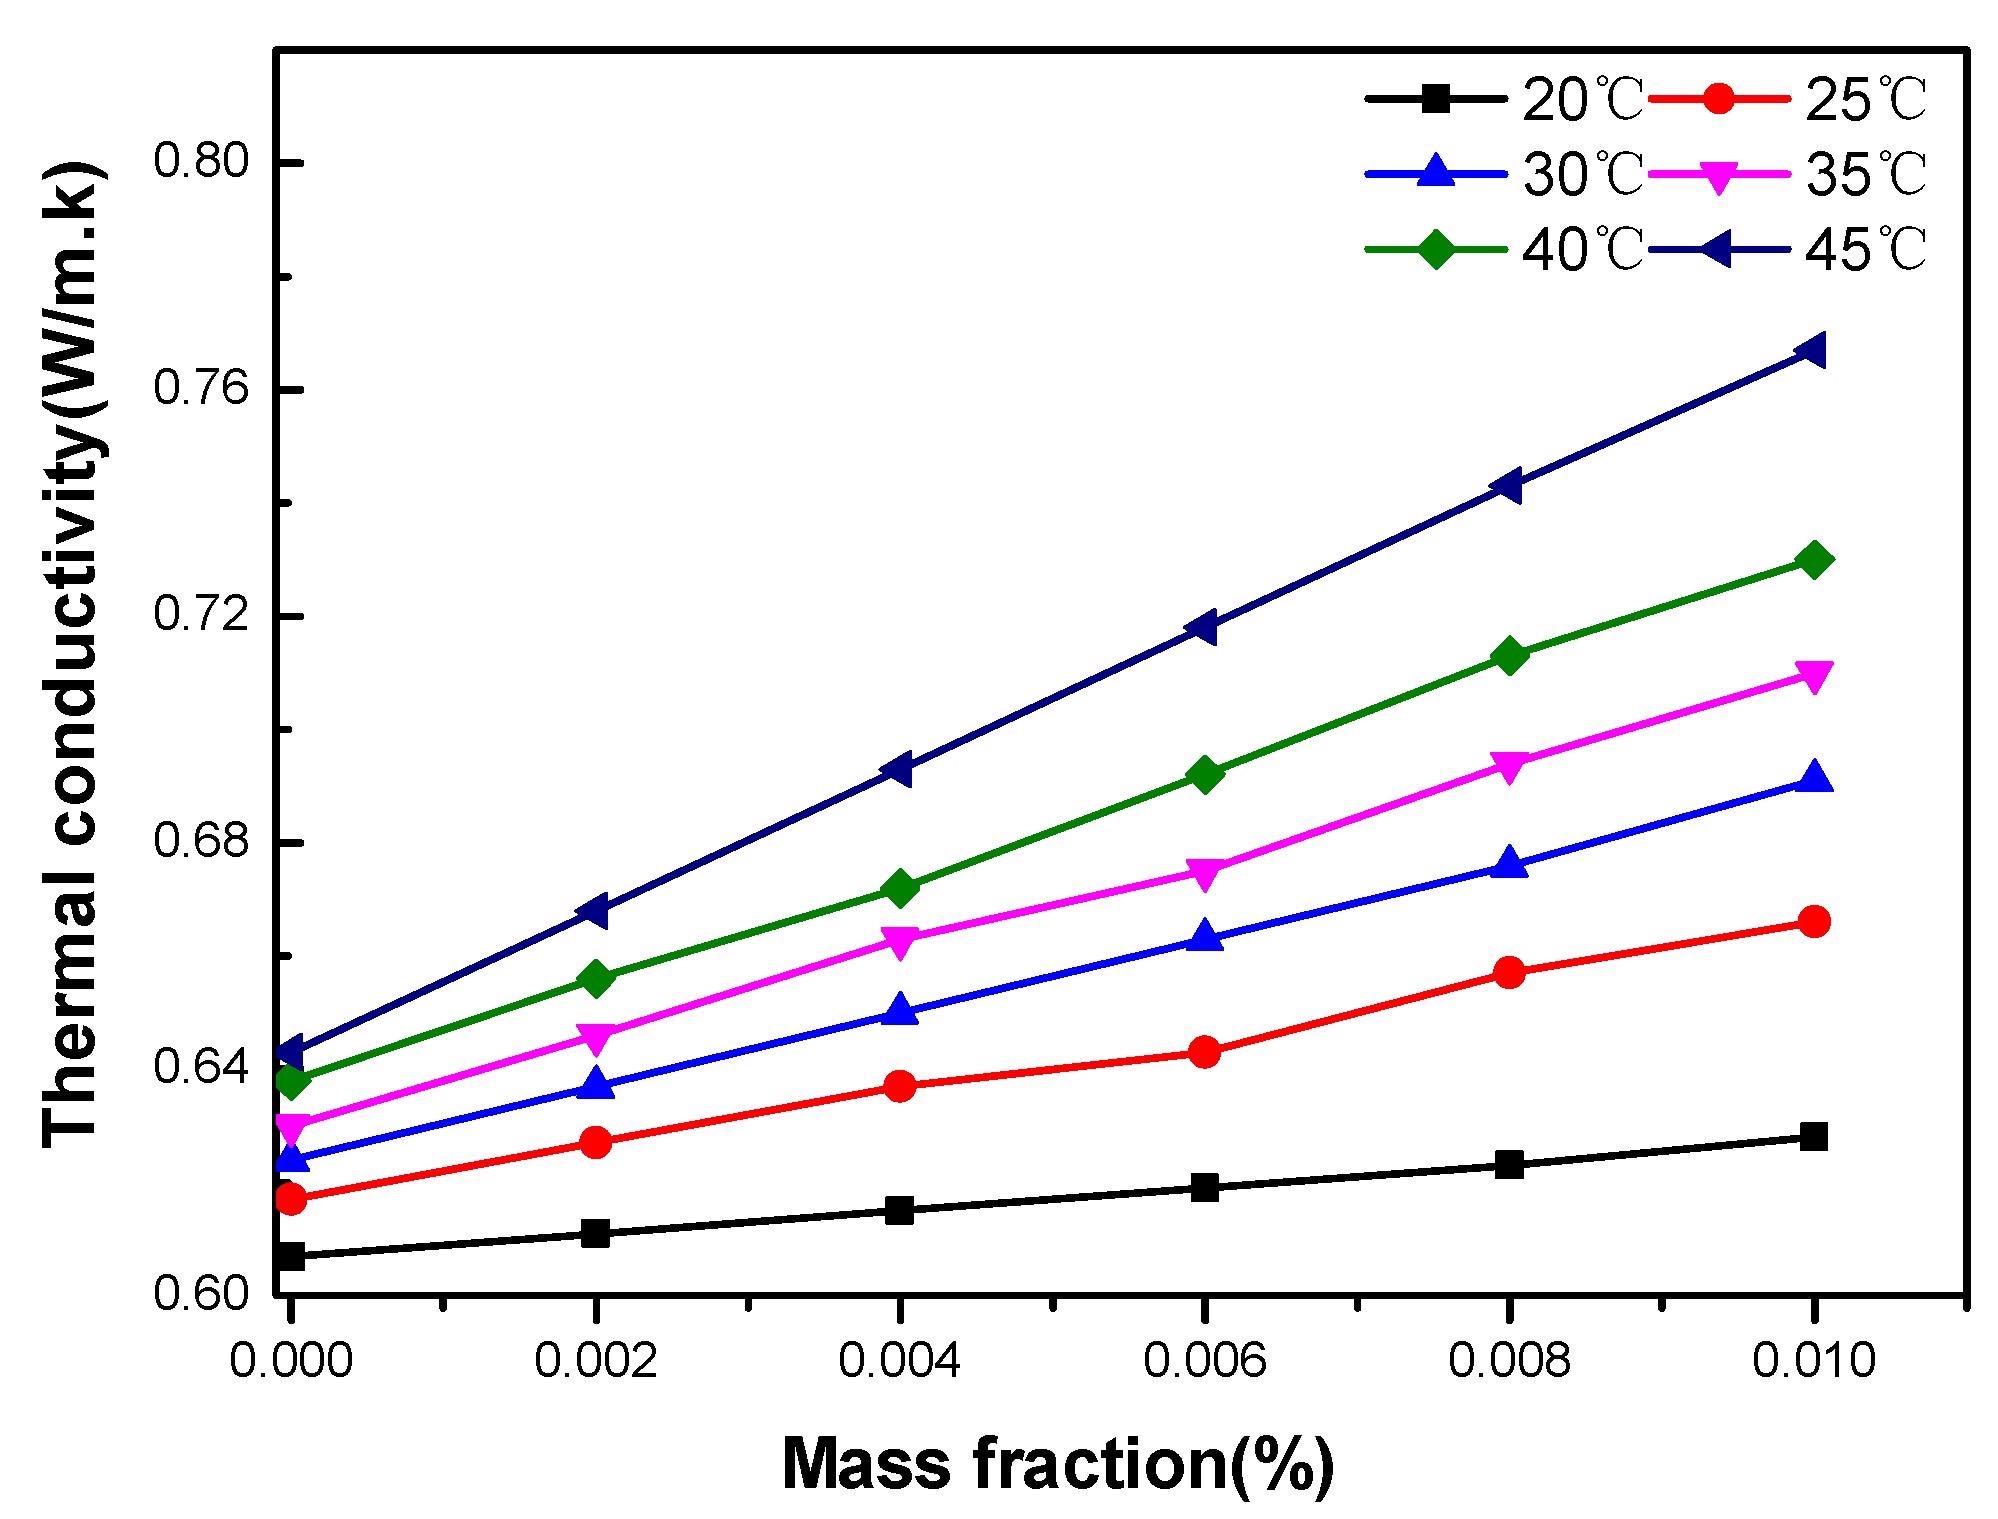
Figure 6. Thermal conductivity of GO–water nanofluid versus mass fraction at various temperatures. Image Credit: Mei, et al., 2022
Figure 7 depicts a comparison of our experimental results with those computed using a formula provided in the literature.
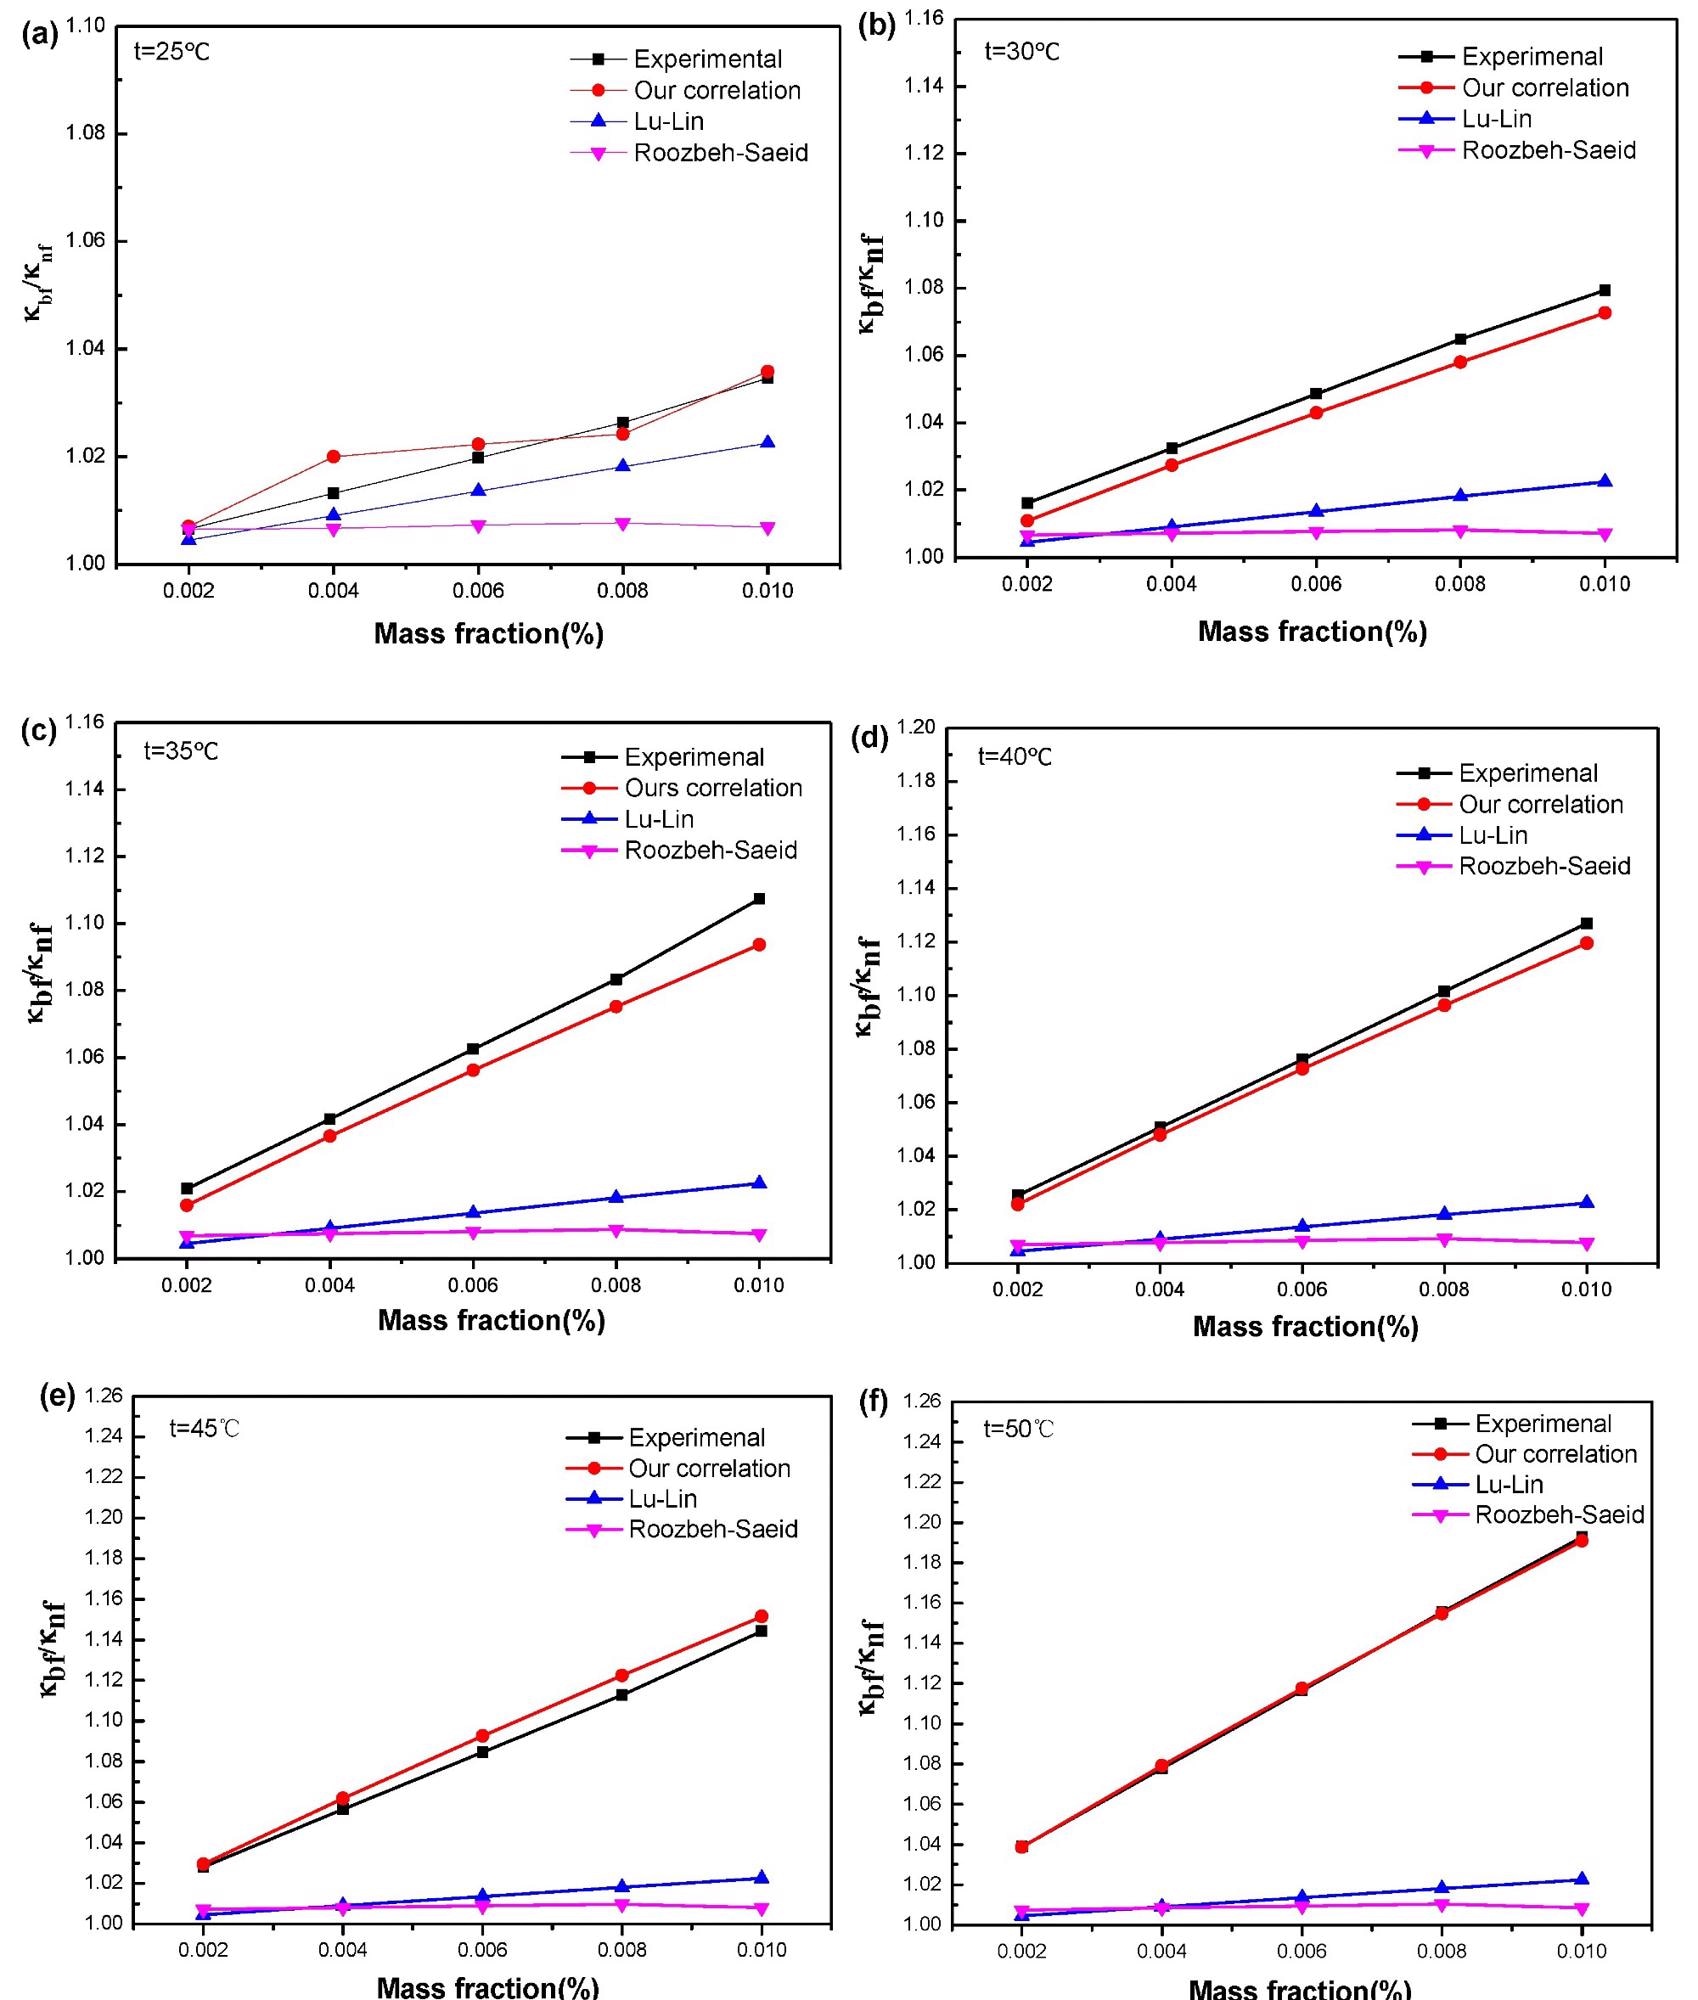
Figure 7. Comparison of experimental data for GO/DI-water-based nanofluids with results from models. (a–f) under temperature of 25, 30, 35, 40, 45 and 50 °C, respectively. Image Credit: Mei, et al., 2022
Figure 8 illustrates the equation’s three-dimensional coordinate diagram.
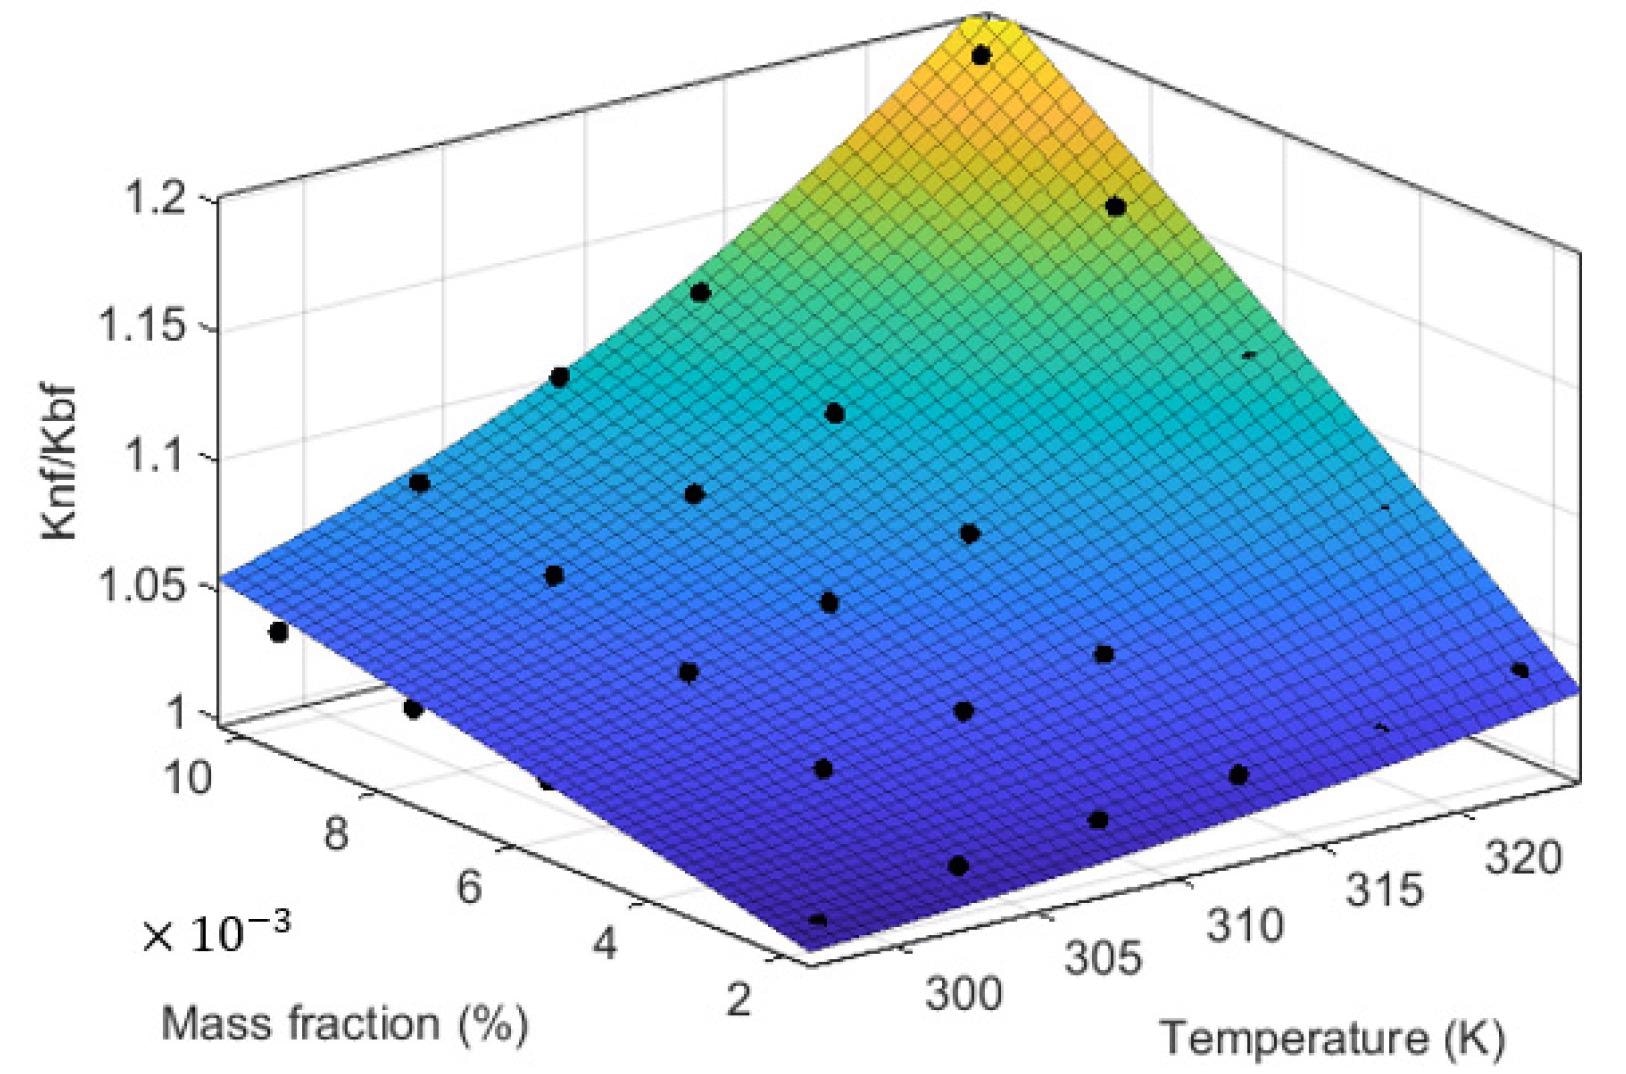
Figure 8. Three-dimension diagram of the proposed correlation. Image Credit: Mei, et al., 2022
The experimentally measured value is compared to the correlation value to test the correctness of the suggested correlation, and the results are displayed in Figure 9.
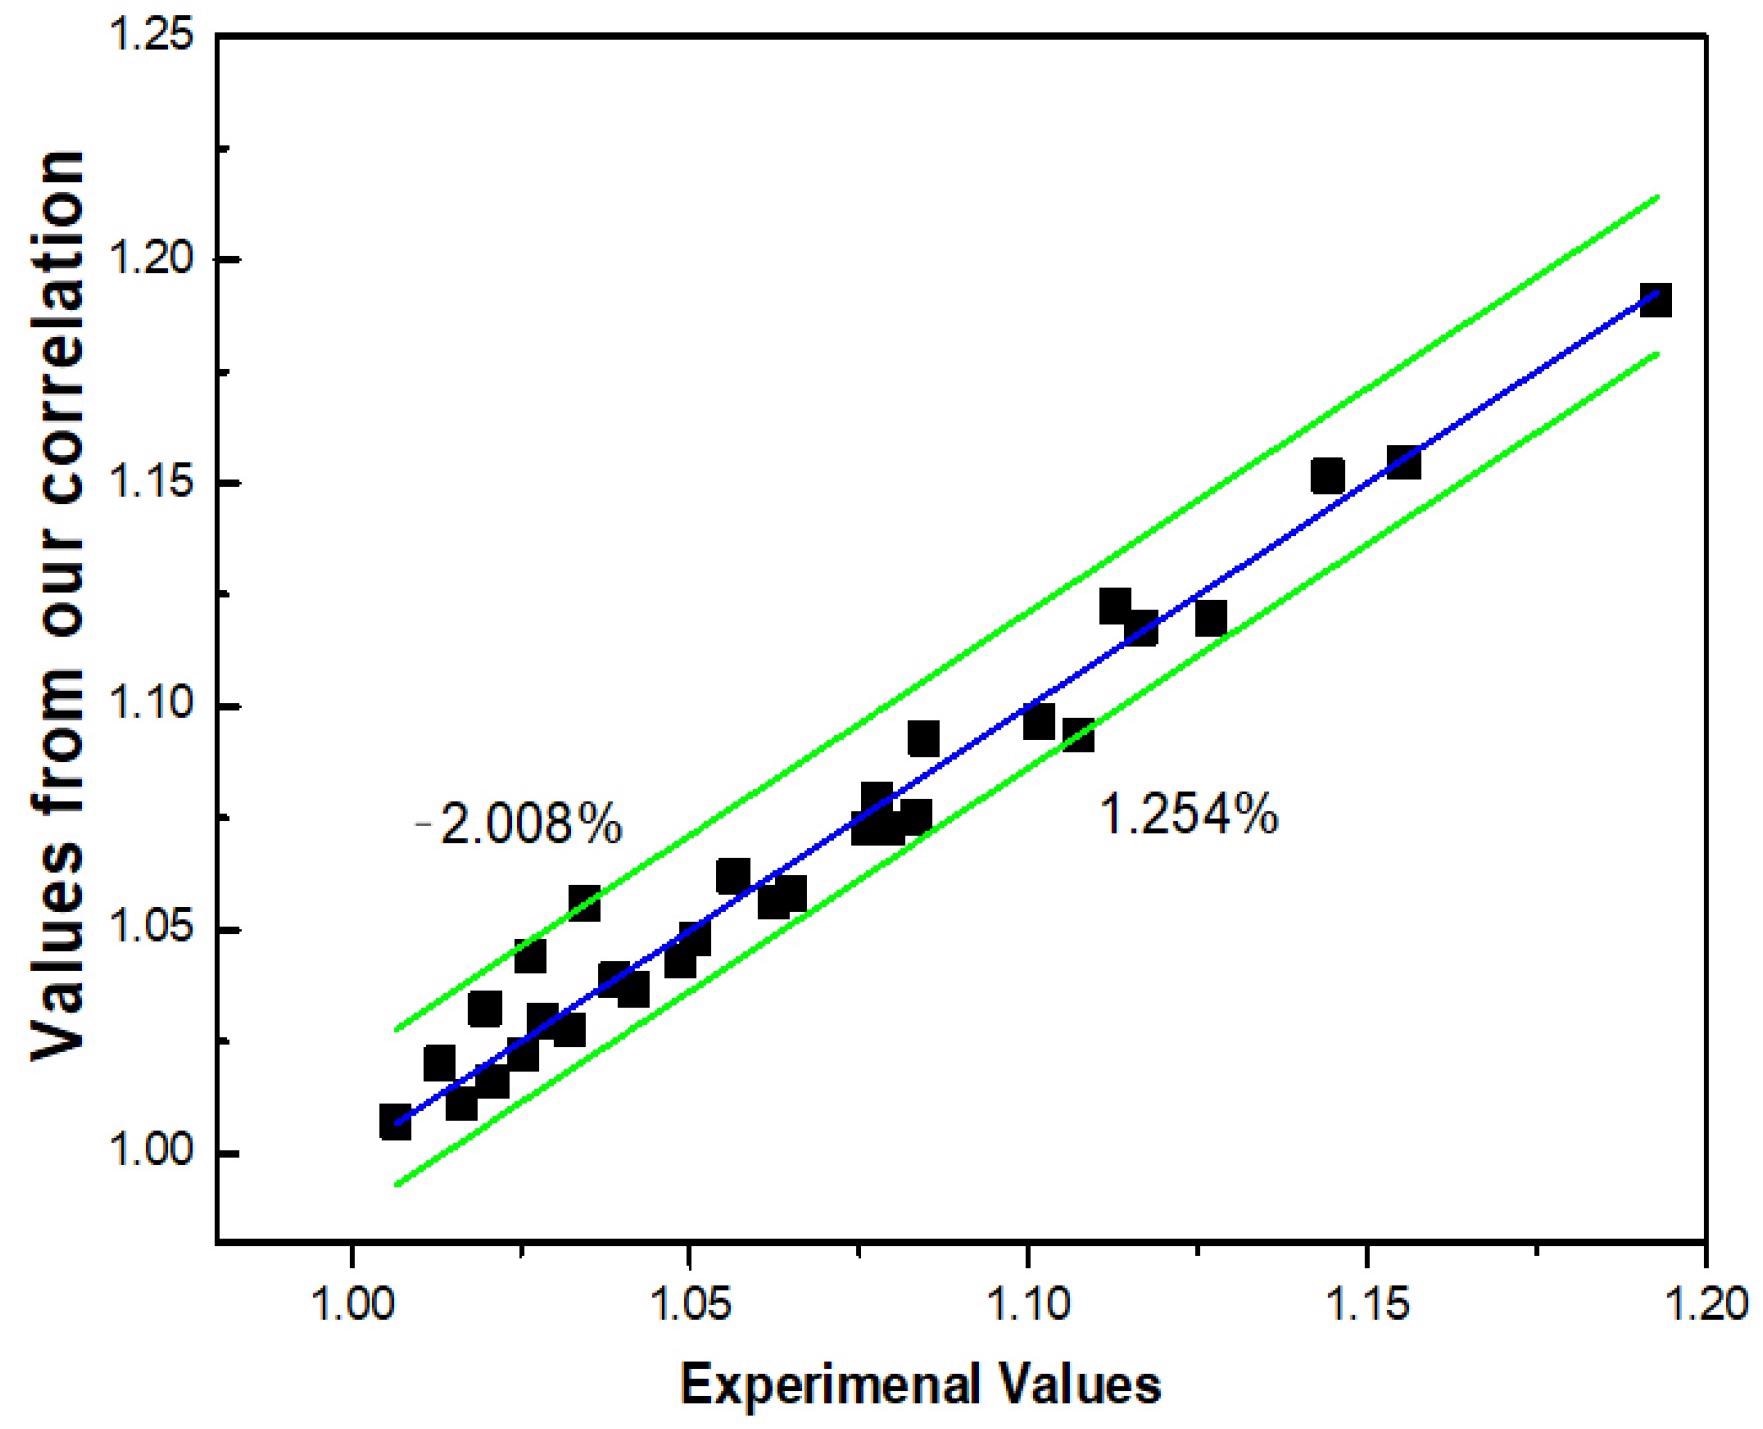
Figure 9. Deviation between the output value of the correlation and the experimentally measured value. Image Credit: Mei, et al., 2022
Conclusion
The viscosity and thermal conductivity of graphene oxide nanofluids were studied in this research. Temperatures vary from 25–50 °C, with mass concentrations of 0.002%, 0.004%, 0.006%, 0.008%, and 0.010%, respectively. After 20 days of standing, no agglomeration or sedimentation of the prepared nanofluids was found, indicating that the synthesized graphene oxide–water nanofluid is very stable.
These findings reveal that when the temperature rises, the dynamic viscosity of nanofluids reduces as their thermal conductivity increases. Researchers show that graphene oxide nanofluids may significantly increase heat transfer performance, particularly at high temperatures. The increase in thermal conductivity is due to the higher Brownian motion of nanoparticles and higher molecular kinetic energy as temperature rises.
When the nanofluid concentration is 0.01% and the temperature is 50 °C, the maximum thermal conductivity enhancement is attained. Finally, and most crucially, researchers present their mathematical model of correlation and undertake a series of experiments to evaluate its correctness, taking into account the inaccuracy of current experimental correlations to projected levels of thermal conductivity.
With temperature and concentration as independent variables, the experimental correlations demonstrate high agreement and accuracy with the experimental results. It is worth mentioning that this correlation is semi-empirical, as it is based on experimental data from five different graphene oxide nanofluids with mass fractions ranging from 0.002–0.01%, investigated at temperatures ranging from 25–50 °C.
As a result, in terms of volume fraction and temperature, the model is extremely accurate within this range. Fortunately, by combining this range with published data at higher temperatures, researchers believe that this model will be relevant in most application areas.
Journal Reference
Mei, X., Sha, X., Jing, D. and Ma, L. (2022) Thermal Conductivity and Rheology of Graphene Oxide Nanofluids and a Modified Predication Model. Applied Sciences, 12(7), p.3567. Available Online: https://www.mdpi.com/2076-3417/12/7/3567/htm.
References and Further Reading
- Gonçalves, I., et al. (2021) Thermal Conductivity of Nanofluids: A Review on Prediction Models, Controversies and Challenges. Applied Sciences, 11(6), p. 2525. doi.org/10.3390/app11062525.
- Yu, S. -P., et al. (2021) Enhanced Heat Transfer Performance of the Tube Heat Exchangers Using Carbon-Based Nanofluids. Applied Sciences, 11(17), p. 8139. doi.org/10.3390/app11178139.
- Jin, J. Y., et al. (2021) Experimental investigation and prediction of the thermal conductivity of water-based oxide nanofluids with low volume fractions. Journal of Thermal Analysis and Calorimetry, 135, pp. 257–269. doi.org/10.1007/s10973-018-7045-x.
- Kleinstreuer, C & Yu, F (2011) Experimental and theoretical studies of nanofluid thermal conductivity enhancement: A review. Nanoscale Research Letters, 6, p. 229. doi.org/10.1186/1556-276X-6-229.
- Mehrali, M., et al. (2013) Preparation and properties of highly conductive palmitic acid/graphene oxide composites as thermal energy storage materials. Energy, 58, pp. 628–634. doi.org/10.1016/j.energy.2013.05.050.
- Baby, T T & Ramaprabhu, S (2011) Enhanced convective heat transfer using graphene dispersed nanofluids. Nanoscale Research Letters, 6(1), pp. 289–299. doi.org/10.1186/1556-276x-6-289.
- Chen, L & Xie, H (2010) Surfactant-free nanofluids containing double- and single-walled carbon nanotubes functionalized by a wet-mechanochemical reaction. Thermochimica Acta, 497, pp. 67–71. doi.org/10.1016/j.tca.2009.08.009.
- Wakif, A., et al. (2022) New insights into the dynamics of alumina-(60% ethylene glycol + 40% water) over an isothermal stretching sheet using a renovated Buongiorno’s approach: A numerical GDQLLM analysis. International Communications in Heat and Mass Transfer, 133, p. 105937. doi.org/10.1016/j.icheatmasstransfer.2022.105937.
- Nayak, M. K., et al. (2020) Numerical Differential Quadrature Examination of Steady Mixed Convection Nanofluid Flows Over an Isothermal Thin Needle Conveying Metallic and Metallic Oxide Nanomaterials: A Comparative Investigation. Arabian Journal for Science and Engineering, 45, pp. 5331–5346. doi.org/10.1007/s13369-020-04420-x.
- Zaydan, M., et al. (2022) Significances of blowing and suction processes on the occurrence of thermo-magneto-convection phenomenon in a narrow nanofluidic medium: A revised Buongiorno’s nanofluid model. Case Studies in Thermal Engineering, 22, p. 100726. doi.org/10.1016/j.csite.2020.100726.
- Rasool, G & Wakif, A (2021) Numerical spectral examination of EMHD mixed convective flow of second-grade nanofluid towards a vertical Riga plate using an advanced version of the revised Buongiorno’s nanofluid model. Journal of Thermal Analysis and Calorimetry, 143, pp. 2379–2393. doi.org/10.1007/s10973-020-09865-8.
- Xia, W. F., et al. (2021) Gear-generalized differential quadrature analysis of oscillatory convective Taylor-Couette flows of second-grade fluids subject to Lorentz and Darcy-Forchheimer quadratic drag forces. International Communications in Heat and Mass Transfer, 126, p. 105395. doi.org/10.1016/j.icheatmasstransfer.2021.105395.
- Wakif, A., et al. (2021) Dynamics of radiative-reactive Walters-b fluid due to mixed convection conveying gyrotactic microorganisms, tiny particles experience haphazard motion, thermo-migration, and Lorentz force. Physica Scripta, 96, p. 125239. doi.org/10.1088/1402-4896/ac2b4b.
- Alghamdi, M., et al. (2021) Significance of variability in magnetic field strength and heat source on the radiative-convective motion of sodium alginate-based nanofluid within a Darcy-Brinkman porous structure bounded vertically by an irregular slender surface. Case Studies in Thermal Engineering, 28, p. 101428. doi.org/10.1016/j.csite.2021.101428
- Ghozatloo, A., et al. (2013) Preparation of nanofluids from functionalized Graphene by new alkaline method and study on the thermal conductivity and stability. International Communications in Heat and Mass Transfer, 42, pp. 89–94. doi.org/10.1016/j.icheatmasstransfer.2012.12.007.
- Jing, D. W., et al. (2015) Preparation of highly dispersed nanofluid and CFD study of its utilization in a concentrating PV/T system. Solar Energy, 112, pp. 30–40. doi.org/10.1016/j.solener.2014.11.008.
- Sun, L., et al. (2021) Insights into the rheological behavior of ethanol-based metal oxide nanofluids. Journal of Molecular Liquids, 323, 115006. doi.org/10.1016/j.molliq.2020.115006.
- Chopkar, M., et al. (2008) Effect of Particle Size on Thermal Conductivity of Nanofluid. Metallurgical and Materials Transactions A, 39, pp. 1535–1542. doi.org/10.1007/s11661-007-9444-7.
- Lu, S -Y & Lin, H -C (1996) Effective conductivity of composites containing aligned spheroidal inclusions of finite conductivity. Journal of Applied Physics, 79(9), p. 6761. doi.org/10.1063/1.361498.
- Taherialekouhi, R., et al. (2019) An experimental study on stability and thermal conductivity of water-graphene oxide/aluminum oxide nanoparticles as a cooling hybrid nanofluid. International Communications in Heat and Mass Transfer, 145, p. 118751. doi.org/10.1016/j.ijheatmasstransfer.2019.118751