|
We propose a standard sample for Atomic Force Microscopy calibration at the nanoscale, operating in Contact Mode (CM) and Tapping Mode (TM), both in air and in fluid. The sample consists of gold colloids which have been suitably immobilized on glass substrate in order to minimize height artifacts that are often present in TM in air. Our sample also allows a prompt evaluation of tip quality and a reliable estimation of tip radius of curvature.
Background
In the field of nanotechnology, where properties and functionality of nanostructures critically depend on their dimensions, measuring size differences of the order of nanometers or even angstroms is of fundamental importance. The Atomic Force Microscope (AFM) finds many applications in the field, not only as sizing tool but also for advanced characterization at the nanoscale.
Factors Affecting The Precision and Accuracy in and Atomic Force Microscope
However, the accuracy and precision of the quantitative measurements made with AFM can be somehow limited by instrumentation errors. The scanners may exhibit several behaviours, such as aging, hysteresis and creep, which can introduce uncertainties in measurements. The accuracy of measurements may also be affected by not completely independent x, y and z motion: in many AFM, a single piezoelectric tube scanner controls motion both in the x-y plane as well as along z, causing cross-talk among the three axes and nonlinearities. In addition, nonlinearities are sometimes associated with the photodiode used in the optical detection system. Even the tip can introduce artifacts. As the tip wears, it does not accurately probe narrow or sharp structures on a sample, with consequent underestimation of surface roughness and broadening of sharp surface features.
Calibration of Instruments
In this context, evidently, it is necessary to carefully calibrate the measuring device in order to obtain measurements which are accurate, precise and reproducible, as well as to monitor tip shape and eventually to determine whether the tip should be replaced to avoid faulty interpretation of data. An ideal calibration procedure involves measurements on a calibration standard of precisely known shapes and sizes preferably spanning the size range of objects which have to be measured [1-4].
Types of Calibration Samples
Different calibration samples at the nanoscale have been proposed. A simple calibration standard can be obtained by creating etch pits (2 nm high) in muscovite mica [5]. However such sample is usually limited to height calibration and it is not very helpful to check the tip quality.
As an alternative, suitably patterned silicon gratings have been proposed: circular or square posts/depressions, hundreds of nm high, are sometimes employed for height calibration whereas very sharp structures are mostly used to test tip quality. In the latter case neat spike structures, which work as "delta-like function" features, may provide an inverted image of the scanning tip. However these samples, besides requiring special care for good imaging, are very delicate.
Calibration samples consisting of glass or polystyrene spheres (with nominal diameter ranging between 50 nm and few microns) immobilized on a flat substrate have been used for height calibration [6]. For a simultaneous evaluation of tip quality, smaller spheres (with diameter comparable to tip radius of curvature) have to be employed. In this case, gold colloidal nanoparticles with variable diameter starting from a minimum value of 5 nm, have been proposed [7]. Even if these kind of reference samples are of great help both for testing scanner calibration and tip quality, it is worth stressing that their employ has been limited to contact mode operation (CM-AFM) in air. Such operation mode does not necessarily imply the use of the samples as height standard in tapping mode (TM-AFM); indeed, when operating in TM, especially if in air, additional height anomalies may affect standard sample characterization thus prohibiting z-piezo calibration.
Shortcomings When Calibrating for Tapping Mode Operation
As a matter of fact, height anomalies were observed in TM-AFM imaging of several inorganic samples in air such as for example Cu clusters [8], CdSe quantum dots [9], gold clusters [10] and magnetite nanoparticles [11]. The situation is even more critical for organic/biological samples [12]. For instance, in DNA strands when imaged by TM-AFM in air [13-19], a vertical size of 0.7 nm over the substrate was estimated, which is much lower than the theoretical diameter of 2 nm deduced from the Watson-Crick DNA model [20]. This discrepancy was attributed to sample deformation by tip compression, to molecule dehydration and to salt deposition [13,19]. However, sample compression and/or dehydration cannot be invoked as origin of height artifacts in the case of inorganic nanoparticles.
Issues Associated with Reproducibility in Tapping Mode AFM Operation
Most authors, devoted to the understanding of the real source of height reduction in TM-AFM measurements in air, agree in considering the attractive forces acting between the tip and the sample surface as the origin of most anomalies [9,14,21,22]. These adhesion forces are due to the water layer that, in ambient conditions, covers both tip and sample [23]: when the scanning tip touches this layer, capillary force causes the formation of a meniscus [24] and the surface tension pulls the cantilever down into the layer. The intensity of these attractive forces depends on the thickness of the water layer, which in turn is a function of surface hydrophobicity [14]. The contribution of adhesion forces to TM-AFM image contrast is particularly critical when scanning over heterogeneous surfaces, since inhomogeneous adhesion forces may produce significant discrepancy between recorded height and real size of the imaged object [14,25]. Since the weight of these effects greatly depends on environmental temperature, relative humidity and some experimental conditions, such as the scanning tip and parameters [9,26], the reproducibility of TM-AFM measurements can be significantly compromised.
Taking in mind previous considerations, optimal z-piezo calibration requires the employ of a standard sample whose measured morphological characteristics are well reproduced even in TM-AFM in air.
Devising a Calibration Sample for Contact Mode and Tapping Mode AFM
The aim of this work is to propose a standard sample at the nanoscale for AFM piezo calibration along z-direction, not only when operating in CM but also in TM (both in air and in fluid ambient). We have focused on gold colloidal nanoparticles which have been suitably immobilized on glass substrate in order to minimize artifacts frequently present in TM configuration. In order to warrant the reliability of the standard sample, the nanoparticles have been fully characterized, prior to immobilization on the glass substrate, by Transmission Electron Microscopy (TEM).
The use as calibration source of single nanoparticles which have been independently characterized by another technique also offers the possibility to characterize the AFM tip, providing for instance a reliable estimate of its radius of curvature.
Methods and Materials
Sample Preparation
All chemicals and solvents were purchased from Sigma-Aldrich and used without further purification. Glass slides were cleaned by immersion in freshly prepared “piranha” solution (H2O2 (30%) : H2SO4 (96%) = 1:2) for 1 hour (warning: piranha solution strongly reacts with organic materials and should be handled with extreme caution). The glass substrates have been then washed with milli-Q water and dried in a stream of high-purity nitrogen.
Subsequently, the glass surface was treated with (3-mercaptopropyl)-trimethoxysilane (MPTMS) solution for 3 minutes at room temperature. The solution was prepared by diluting MPTMS in chloroform to get a final concentration equal to 0.3 M. The slides were finally rinsed with copious chloroform and milli-Q water and dried with nitrogen gas.
Gold colloids of 5 nm diameter were deposited on silanized glass slides by spin coating (Sample 1). Spin speed and time were adjusted to ensure high density of homogeneously distributed single colloidal particles over the glass substrate, as confirmed by subsequent AFM imaging.
Some additional test samples were also prepared by following different recipes, namely by alternatively treating the clean glass surface with (3-aminopropyl)-triethoxysilane (APTES) (Sample 2) or by using the clean glass substrates without any further functionalization (Sample 3). In these samples, the deposition of gold colloids was done as described above for Sample 1.
AFM Imaging
For CM-AFM measurements, the XE-100 AFM (PSIA Corp., Korea) was used, equipped with a 50-μm scanner. The images were recorded by working in low voltage mode. In this configuration the setpoint was about 1 nN, and the scan rate 2 Hz. Silicon CM-AFM probes (PSIA Corp., Korea) had typical spring constant of 0.6 N/m and nominal tip radius of curvature of 20 nm.
TM-AFM measurements were carried out with a NanoscopeIIIa/Multimode scanning probe microscope (Digital Instruments, Santa Barbara, Ca) equipped with a 12-μm scanner. Standard silicon cantilevers (RTESP cantilevers, Veeco Probe Centre, Santa Barbara, Ca), with a typical spring constant of 20-80 N/m and a nominal radius of curvature ≤ 10 nm, were used for ambient air TM-AFM imaging, whereas oxide-sharpened silicon nitride cantilevers (MSCT-AUHW probes, Veeco Probe Centre, Santa Barbara, Ca) with a spring constant of 0.5 N/m and a nominal radius of curvature ≤ 20 nm were used for TM-AFM in fluid. The cantilevers were oscillated near their resonance frequency ω0 (ω* = 0.85 ω0), with a free amplitude at the resonance of A0 = 1.5 V (corresponding to an oscillation amplitude of about 20 nm). The amplitude setpoint was set to be 85% of the value of free amplitude A* at the working resonance ω*. Typical scan rate was 1.5 Hz.
TEM Imaging
TEM characterization was performed by using a Jeol 1200 EX II electron microscope at 10 kV. TEM specimens consist of coal and collodion coated copper grids. The nanoparticles were deposited on the grids directly from solution, and left dry. Images have been recorded with 5 s integration time and magnification 200.000 x.
Results and Discussion
TEM Characterisation
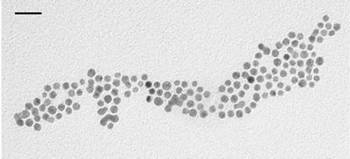
Before the AFM characterisation of the immobilized nanoparticles, gold colloid size has been independently measured by TEM imaging. A representative TEM image of Au colloids is shown in Fig. 1.
|
|
|
Figure 1. TEM image of gold nanoparticles. Scale bar: 20 nm.
|
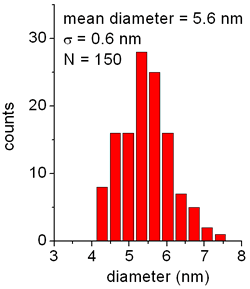
The statistics over more than one hundred nanoparticles (shown in Fig. 2) is indicative of a monodisperse distribution of particle diameter, with mean value equal to 5.6 nm and standard deviation 0.6 nm, whereas the minimum and maximum measured values are 4 nm and 7.6 nm respectively.
|
|
|
Figure 2. Statistical analysis of colloid diameter, as evaluated from TEM imaging of 150 nanoparticles.
|
These values are reliable and reproducible, as also confirmed when TEM imaging was repeated using a different experimental set-up, which provided for the mean diameter and standard deviation the values 5.5 nm and 0.6 nm respectively (evaluated over 125 nanoparticles).
Contact Mode AFM
CM and TM-AFM has been carried out on the glass substrates. Except for the presence of occasional 2-nm deep holes, the surface is quite flat, exhibiting a RMS roughness ranging between 0.3 nm (clean glass surface) and 0.5 nm (silanized glass surface), over a 500x500 nm2 area.
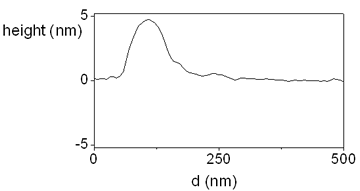
After colloid deposition, before TM-AFM analysis, samples have been first tested by CM-AFM. A representative CM-AFM topography of gold nanoparticles deposited on the MPTMS glass surface (Sample 1) is shown in Fig. 3 a. Single colloids appear stably bound to the MPTMS glass substrate, and display homogeneous lateral and vertical dimension, with no evidence of aggregates. Height evaluation has been obtained by cross section profile, reported for a single colloid in Fig. 3 b. The statistical distribution of the vertical size, resulting from cross section analysis over 30 gold nanoparticles, is summarized in the histogram of Fig. 3 c.
|
(a)
(b)
(c)
|
|
Figure 3. (a) Topographic image of Au colloids deposited on MPTMS treated glass (Sample 1) as measured by CM-AFM in air. (b) Typical cross section profile, shown in the figure for the colloid indicated by the white arrow in (a). (c) Statistical distribution of the gold colloid height as evaluated by single particle cross section profiles.
|
The 5.5 nm mean value of nanoparticle height, which provides an estimate of colloid diameter, is in very good agreement with values obtained from TEM characterization. The lateral size (evaluated as the FWHM of the nanoparticle cross section profile) is monodisperse (data not shown), with results subject to significantly broadened because of the well known tip convolution effect [27]. We will discuss this point in the following, when presenting the TM-AFM data.
Tapping Mode AFM
After checking that the immobilized nanoparticles are well reproduced by CM-AFM, we tested Sample 1 as a possible standard sample also when operating in TM configuration. Indeed, as discussed in the introduction, the good reproducibility of sample topography by CM-AFM does not necessarily imply similar reliability in TM-AFM measurements.
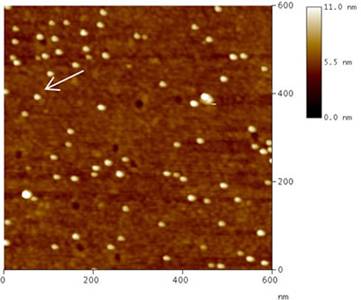
A typical TM-AFM topography of Sample 1, as recorded in air, is shown in Fig. 4 a. As already observed in the CM-AFM characterization, single colloids can be easily resolved on the glass substrate. An estimate of particle diameter can be provided by the vertical size of the colloid above the substrate, as evaluated by a single-particle cross section profile (Fig. 4 b).
|
(a)
(b)
|
|
Figure 4. (a) Topographic image of Au colloids deposited on MPTMS treated glass (Sample 1) as measured by TM-AFM in air. (b) Cross section profile referring to the colloid indicated by the white arrow in (a).
|
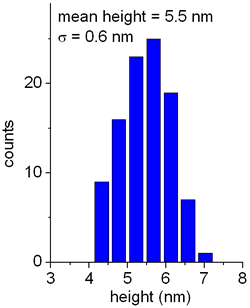
The height statistical distribution, resulting from TM-AFM cross section analysis on 100 different gold nanoparticles, is summarized in the histogram of Fig. 5.
|
|
|
Figure 5. Statistical analysis of gold colloid height on the MPTMS treated glass surface (Sample 1) as measured by TM-AFM in air. Data are obtained from individual cross section profiles over 100 nanoparticles.
|
The distribution is monodisperse and centered at a mean value of 5.5 nm with a standard deviation of 0.6 nm. The minimum and maximum measured heights are 4.2 and 7 nm respectively. Similar values have been obtained also on samples from different MPTMS preparations (data not shown), proving the reproducibility of this recipe.
The TM-AFM measured height well compares with the value expected, as provided by TEM characterization and by the CM-AFM imaging. The good agreement of the data clearly indicates the absence of height artifacts when characterizing Sample 1 by TM-AFM in air. As already observed in CM, also in TM the lateral size is monodisperse and broadened by tip convolution effect [27].
AFM Imaging in Fluid Ambient
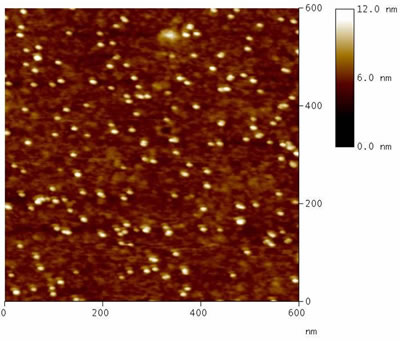
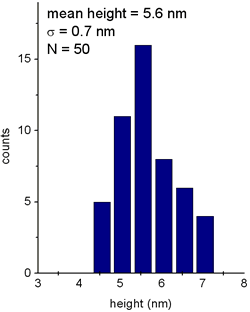
The Au-colloid MPTMS samples have been also imaged in fluid ambient. In Fig. 6 a, a representative topography recorded in milli-Q water is shown. The corresponding statistical analysis of vertical size, as estimated by cross section profiles over several single colloids, is reported in Fig. 6 b.
|
(a)
(b)
|
|
Figure 6. (a) Representative topograph of Au colloids on MPTMS treated glass substrate (Sample 1) recorded by TM-AFM in fluid ambient (milli-Q water); (b) corresponding statistical distribution of colloid height as estimated from cross section profiles analysis over 50 nanoparticles.
|
Again, the size of single colloids (mean height = 5.6 nm, σ = 0.7 nm) well agrees with data from TEM analysis, as well as with previously discussed AFM characterization in air.
Effects of Ageing on the Gold Colloids
The possible effects of aging on the Au colloids immobilized on the MPTMS treated glass substrate have been tested. Specifically, both CM and TM-AFM imaging of Sample 1 was found to be reproducible after 2-month air exposure.
The good agreement with results obtained by TEM imaging, the great reproducibility of morphological characterization, as well as the stability in time, make Sample 1 suitable for reliable AFM height calibration at the nanoscale when operating in TM.
Other Unsuccessful Trials
A similar extensive characterization (not shown here) was performed also for Sample 2 and 3 (Au colloids adsorbed on APTES-treated glass surface or directly on glass substrate respectively). However TM-AFM characterization of these samples was not as free of artifacts as that of Sample 1. Specifically, a reduced vertical dimension was observed for gold nanoparticles in both samples, especially when imaged in ambient conditions, as for inhomogeneous adhesion forces on sample surface [14,25]. Therefore, these two alternative preparation methods are not indicated to provide samples which are suitable for AFM piezo calibration.
Checking AFM Tip Status
The reliability of Sample 1 can be also exploited to test the AFM tip. Indeed, thanks to the nanometric and monodisperse size of the particles (comparable to tip radius of curvature) and their incompressibility, Sample 1 allows checking if the tip is dull or dirty and if it eventually needs to be changed. The presence of homogeneous regular spherical objects well distinguishable over a nearly flat surface, easily emphasize the quality of the probe: if a worn or dirty tip is used, the image shows odd features, all with same shape, in stead of the regular spherical spots, since what is really imaged is the shape of the blunt tip or the shape of debris, and not the morphology of the nanoparticles.
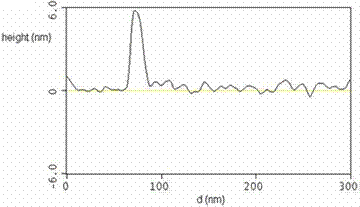
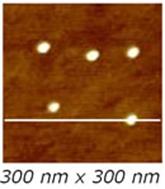
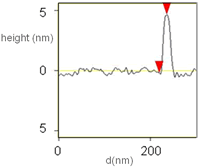
Conversely, when using a new tip, the sample high-resolution TM-AFM image appears as in Fig. 7.
|
(a)
(b)
|
|
Figure 7. (a) 300 x 300 nm2 TM-AFM image of the Sample 1 and (b) typical cross section profile.
|
Estimating Tip Radius
Sample 1 is also suitable for an estimate of the tip radius of curvature. When a pyramidal tip with curvature radius equal to R scans across a spherical particle with radius r, the measured profile has a width W and a height h which, in first approximation, are correlated by the relation W2 = 8 R h [7]. Such approximation is valid when the measured structure (in our case the nanoparticle) has a radius of curvature comparable or even smaller than that of the measuring tip (we remind here that tip typical radius of curvature is R > 5 nm). As an example, we refer to the case of the 300 x 300 nm2 TM-AFM image recorded by using a new tip (Fig. 7). From the cross section profile on the nanoparticle we get h = 4.9 nm and W = 16.5 nm. Therefore, by applying the approximated formula, we obtain for R a value of 7 nm, which is comparable with nominal tip radius of curvature expected to be ≤ 10 nm.
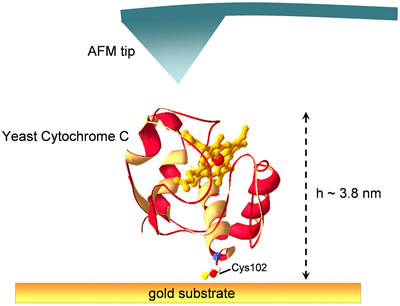
The great advantage of such an AFM standard sample comes out when characterizing samples at the nanoscale. As an example we report here the morphological characterization of single proteins adsorbed on a metal substrate. In particular we refer to Yeast Cytochrome C (YCC), a redox protein bearing an exposed cysteine (Cys102) suitable for specifically oriented immobilisation on Au(111) via the formation of covalent S-Au bonds [3,4]. This small metalloprotein (MW = 12.5 kDa) can be schematically represented by an ellipsoid with axes size in the range 3.5-4.0, as from X-ray crystallographic data [28]. If we refer to the topological arrangement corresponding to protein immobilization on gold via Cys102 residue (see Fig. 8), the expected value for YCC vertical size on the gold substrate is about 3.8 nm.
|
|
|
Figure 8. Graphic representation showing Yeast Cytochrome c adsorbed on a gold substrate via the sulfur atom of Cys102 residue.
|
In order to warrant a reliable topological characterization of the adsorbed proteins by AFM, a very precise calibration of the instrument is needed at the nanoscale. Therefore, before starting on with AFM imaging of adsorbed YCC molecules, we optimized the AFM scanner calibration by measuring Sample 1. Subsequently, the so calibrated AFM was used to characterize the gold-immobilized proteins [29]. A representative TM-AFM image of the adsorbed YCC molecules recorded in buffer solution (1mM Tris, pH 8.0) is shown in Fig. 9 a. Single molecules can be clearly distinguished on the gold substrate. An estimation of protein diameter is provided by the molecule vertical size above the substrate. A typical cross section profile of a single YCC molecule is shown in Fig. 9 b.
The measured height (3.7 nm for the profile shown in the figure) results to be in very good agreement with what expected from the X-ray crystallographic data [28].
It is worth stressing that if using a calibration sample with hundreds of nanometers deep steps, the typical step error of a few nanometers, higher than protein (or similar specimens) vertical size, prohibits precise scanner calibration and accurate sample characterization at the nanoscale.
Conclusions
We reported on a procedure to prepare an AFM standard sample which can be used for calibrating the vertical scale of the scanning transducer at the nanometer scale. In particular, gold nanoparticles have been immobilized on glass substrates by following three different methods. We found out that TM-AFM height artifacts are minimized for colloids immobilized on MPTMS treated glass surface, as testified by the optimal agreement with results from TEM imaging. The great reproducibility of morphological characterization, both in air and in fluid ambient, as well as the sample stability in time, undoubtedly make this sample a good candidate as height calibration standard at the nanoscale for TM-AFM, both in fluid and in air. Additionally, thanks to their spherical shape and incompressible nature, the immobilized gold colloids can be exploited to promptly evaluate tip quality and to easily determine tip radius of curvature.
An application of the effectiveness of AFM scanner calibration at the nanometer scale, by means of our standard sample, has been here described. We showed that, thanks to nanoparticle imaging, the scanner calibration can be tested with very high accuracy, so that reliable characterization of samples, such as single proteins adsorbed on a flat gold substrate, can be achieved at the nanoscale.
This example also suggests the possibility to simultaneously adsorb gold nanoparticles and biological material (such as proteins or DNA strands) so that sample height can be easily compared in real time to that of reference nanoparticles.
Acknowledgments
This work has been partially supported by the FIRB-MIUR Project “Molecular Nanodevices” and a PRIN-MIUR 2004 project. We acknowledge Dr. Anna Rita Taddei for Transmission Electron Microscopy measurements, which were performed at C.I.M.E. (Centro Interdipartimentale di Microscopia Elettronica), Tuscia University, Viterbo, Italy. Thanks are due to Ms. Tiziana Cimei for her preliminary AFM measurements.
|
|
1. Andolfi L., Bonanni B., Canters G.W., Verbeet M.Ph., Cannistraro S., “Scanning Probe Microscopy Characterization of Gold-Chemisorbed poplar Plastocyanin Mutants”, Surf. Sci., 530 (3), 181-94, 2003.
2. Bizzarri A.R., Bonanni B., Costantini G., Cannistraro S., “A Combined Study by AFM and MD Simulation of a Plastocyanin Mutant Chemisorbed on a Gold Surface”, Chem. Phys. Chem., 4 (11), 1189-95, 2003.
3. Bonanni B., Alliata D., Bizzarri A.R., Cannistraro S., “Topological and Electron Transfer Properties of Yeast Cytochrome c Adsorbed on Bare Gold Electrode”, Chem. Phys. Chem., 4 (11), 1183-88, 2003.
4. Bonanni B., Alliata D., Andolfi L., Bizzarri A.R., Delfino I., Cannistraro S., “Yeast Cytochrome c on Gold Electrode: a Robust Hybrid System for Bio-Nanodevices”, IEEE-NANO 2004, Fourth IEEE Conference on Nanotechnology, Muenchen, Germany, Aug. 16-19, 2004, 538-40. CODEN: 69HAVP AN 2005:656724 CAPLUS
5. Nagahara L. A., Hashimoto K., Fujishima A., Snowden-Ifft D., Price P. B., “Mica Etch Pits as Height Calibration Source for Atomic Force Microscopy”, J. Vac. Sci. Technol. B, 12 (3), 1694-97, 1994.
6. Li Y. and Lindsay S.M., "Polystyrene Latex Particles as a Size Calibration for the Atomic Force Microscope", Rev. Sci. Instrum., 62 (11) 2630-33, 1991.
7. Vesenka J., Manne S., Giberson R., Marsh T., Henderson E., “Colloidal Gold Particles as an Incompressible Atomic Force Microscope Imaging Standard for Assessing the Compressibility of Biomolecules”, Biophys. J., 65 (3) 992-97, 1993.
8. Palasantzas G., Koch S.A., De Hosson G. Th. M., “Growth and Morphology of Low-Energy Deposited Cu Nanocluster Films”, Rev. Adv. Mater. Sci., 5 (25), 57-61, 2003.
9. Ebenstein Y., Nahum E., Banin U., “Tapping Mode Atomic Force Microscopy for Nanoparticle Sizing: Tip-Sample Interaction Effects”, Nano Letters, 2 (9), 945-50, 2002.
10. Vandamme N., Snauwaert J., Janssens E., Vanderweert E., lievens P., Van Haesendonck C., “Visualization of Gold Clusters Deposited on a Dithiol Self-Assembled Monolayer by Tapping Mode Atomic Force Microscopy”, Surf. Sci., 558 (1-3), 57-64, 2004.
11. Rasa M., Kuipers B.W.M., Philipse A.P., “Atomic Force Microscopy and Magnetic Force Microscopy Study of Model Colloids”, J. Colloid Interface Sci., 250 (2), 303-15, 2002.
12. Marchin K.L., Berrie C.L., “Conformational Changes in the Plasma Protein Fibrinogen upon Adsorption to Graphite and Mica Investigated by Atomic Force Microscopy”, Langmuir, 19 (23), 9883-88, 2003.
13. Moreno-Herrero F., Colchero J., Barò A.M., “DNA Height in Scanning Force Microscopy”, Ultramicroscopy, 96 (2), 167-74, 2003.
14. Van Noort S.J.T., Van der Werf K.O., De Grooth B.G., Van Hulst N.F., Greve J., “Height Anomalies in Tapping Mode Atomic Force Microscopy in Air Caused by Adhesion”, Ultramicroscopy, 69 (2), 117-27, 1997.
15. Lyubchenko Y.L., Shlyakhtenko L.S., Aki T., Adhya S., “Atomic Force Microscopic Demonstration of DNA Looping by GaIR and HU”, Nucl. Acids Res., 25 (4), 873-76, 1997.
16. Maeda Y., Matsumoto T., Kawai T., “Observation of Single- and Double-Stranded DNA Using Non-Contact Atomic Force Microscopy”, Appl. Surf. Sci., 140 (3-4), 400–5, 1999.
17. Ye J. Y., Umemura K., Ishikawa M., Kuroda R., “Atomic Force Microscopy of DNA Molecules Stretched by Spin-Coating Technique”, Anal. Biochem., 281 (1), 21-25, 2000.
18. Moreno-Herrero F., Colchero J., Gomez-Herrero J., Barò A.M., “Atomic Force Microscopy Contact, Tapping, and Jumping Modes for Imaging Biological Samples in Liquids”, Phys. Rev. E, 69 (3), 031951-9, 2004.
19. Wang W., Lin J., Schartz D.C., “ Scanning Force Microscopy of DNA Molecules Elongated by Convective Fluid Flow in an Evaporating Droplet”, Biophys. J., 75 (1), 513-20, 1998.
20. Watson J.D., Crick F.H.C., “Molecular Structure of Nucleic Acids. A Structure for Deoxyribose Nucleic Acid”, Nature, 171 (4356), 737-38, 1953.
21. Kühle A., Sørensen A.H., Bohr J., “Role of attractive forces in tapping tip force microscopy”, J. Appl. Phys., 81 (10), 6562-69, 1997.
22. Zitzler L., Herminghaus S., Mugele F., “Capillary Forces in Tapping Mode Atomic Force Microscopy”, Phys. Rev. B, 66 (15), 1554361-8, 2002.
23. Beaglehole D., Christenson H. K., “Vapor Adsorption on Mica and Silicon: Entropy Effects, Layering, and Surface Forces”, J. Phys. Chem., 96 (8), 3395-403, 1992.
24. Colchero J., Storch A., Luna M., Gómez Herrero J., and Baró A. M., “Observation of Liquid Neck Formation with Scanning Force Microscopy Techniques”, Langmuir, 14 (9), 2230-34, 1998.
25. Bar G., Thomann Y., Brandsch R., Cantow H.-J., and Whangbo M.-H., “Factors Affecting the Height and Phase Images in Tapping Mode Atomic Force Microscopy: Study of Phase-Separated Polymer Blends of Poly(ethene-co-styrene) and Poly(2,6-dimethyl-1,4-phenylene oxide)”, Langmuir, 13 (14), 3807–12, 1997.
26. Mechler A., Kopniczky J., Kokavecz J., Hoel A., Granqvist C.-G., and Heszler P. “Anomalies in nanostructure size measurements by AFM”, Phys. Rev. B, 72 (12) 1254071-6, 2005.
27. Howald L., Haefke H., Lüthi R., Meyer E., Gerth G., Rudin H., and Güntherodt H.-J. “Ultrahigh-Vacuum Scanning Force Microscopy: Atomic-Scale Resolution at Monoatomic Cleavage Steps”, Phys. Rev. B, 49 (8), 5651-56, 1994.
28. Louie G. V., Brayer G. D. “High-Resolution Refinement of Yeast Iso-1-Cytochrome c and Comparisons with Other Eukaryotic Cytochromes c”, J. Molec. Biol., 214 (2), 527-55, 1990.
29. Details of sample preparation are described elsewhere (Refs. 3, 4).
|