Feb 16 2006
Topics Covered
Background
Tribology
Lubricants
Friction and Wear
Studying Nanoscale Tribology
Materials Suited For Analysis
Nanoscale Wear Analysis
Lubricant Studies
Frictional Forces
Simultaneous Measurement of Topography
and Friction Forces
Surface Texture / Morphology / Roughness
Nanoscale Mechanical Properties
Background
Tribology
The term tribology is derived from
the Greek word "tribo" meaning rubbing and "logy" meaning knowledge.
The original applications by the Greeks of tribology were in trying
to understand the motion of large stones across the earth's surface.
Today tribology has grown to include the methodical study of friction,
lubrication, and wear.
Tribology plays a critical role
in diverse technological areas. In the advanced technological industries
of semiconductor and data storage, tribological studies help optimize
polishing processes and lubrication of data storage substrates. In
traditional industries such as automotive and aerospace, tribological
studies help increase the lifespan of mechanical components.
Lubricants
Many industrial processes require
a detailed understanding of tribology at the nanometer scale. The
development of lubricants in the automobile industry depends on the
adhesion of nanometer layers (mono layers) to a material surface.
Assembly of components can depend critically on the adhesion of materials
at the nanometer length scale.
Friction and Wear
There are a number of traditional
tools for characterizing friction, lubrication and wear. The most
common characterization tool is the tribometer having several configurations
such as pin-on-disk, ball on flat, and flat on flat, etc. Generating
motions at the nanometer scale is extremely challenging. New characterization
techniques are required to understand tribology at the nanometer scale.
Studying
Nanoscale Tribology
The atomic force microscope is now
being routinely applied for studying nanoscale tribology. The natural
extension of the AFM for tribology applications is derived from the
motion of a nanometer-sized stylus in the AFM over a surface. Although
traditional tribology testing is not done with an AFM, many new types
of applications are possible.
Examples of the application of AFM
to tribology include:
- Direct three-dimensional visualization of wear tracks, or scars on a surface.
- Measurement of the thickness of solid and liquid lubricants having nanometer
or even monolayer thickness.
- Measurement of frictional forces at the nanometer scale.
- Surface characterization of morphology, texture, and roughness.
- Evaluation of mechanical properties such as hardness and elasticity, and
plastic deformation at the nanometer scale.
Materials
Suited For Analysis
A major advantage of the AFM for
tribological studies is that the AFM can be routinely used on all
types of materials. Materials commonly studied include: ceramics,
metals, polymers, semiconductors, magnetic, optical, and biomaterials.
AFM investigations are usually made in ambient air environment. It
is possible to make AFM studies in a vacuum or liquid environment.
Nanoscale
Wear Analysis
The effects of wear at the nanometer
scale become critical to the optimization and stability of machines
as the tolerances in precision machines become smaller and smaller.
Traditional microscopes such as the optical and scanning electron
microscopes facilitate visualization of wear in 2-dimensions. For
example, with the SEM it is possible to get a magnified view of wear
tracks in the x-y axis but cross sectioning is required for measuring
the depth of wear tracks.
The AFM allows direct 3-dimensional visualization of wear tracks and scars.
The images may be displayed in a 2-D projection and a 3-D projection. Direct
measure of wear track depth can be easily measured with a line profile derived
from the AFM image.
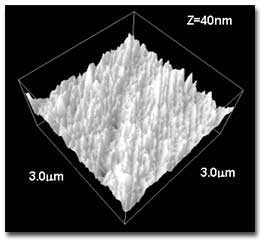
Figure 1. Three-dimensional atomic force microscope (AFM)
image of a polish mark on a piece of steel. The scan range in X and Y is 3 micrometers
and the entire Z range is 40 nanometers.
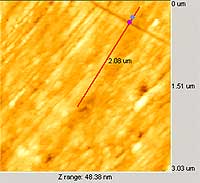
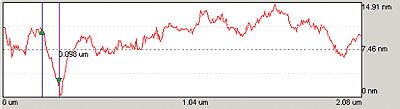
Figure 2. Metrological study of a scratch mark in the
surface of a polished material (stainless steel). Because the AFM directly measures
three-dimensional data, the depth of the scratch mark is easily quantified.
In this case the mark is 8.6 nm deep. Z= 8.6 nm
Lubricant Studies
It is well known that layers of
lubricants on surfaces that are less than 100 nm can dramatically
affect lubrication behavior. Characterization of such films is necessary
for developing optimized lubricating films. However, nanometer scale
characterization of lubrication films offers a substantial challenge.
Optical techniques such ellipsometers can be used for measuring lubrication
thickness of large sections, (greater than 10 square micrometers),
of a surface. Measurement of the localized (less than 1 micron) film
thickness is not possible with the ellipsometer.
The probe is mounted at the end
of a cantilever in an AFM making it possible to measure interaction
forces between the probe and the surface by monitoring the deflection
of the cantilever. A graph, called a force/distance curve, shows the
forces on the probe as the distance between the probe and the surface
are reduced. The nature of the force/distance curve depends on the
force constant of the cantilever, the lubrication density, probe geometry,
and the lubrication thickness.
By measuring the changes in force/distance curves in an AFM it is possible
to directly ascertain the thickness of lubrication films. Below is an example
of a force/distance curve for a surface with no lubrication film compared to
one with a lubrication film. The thickness of the film is established from the
force/distance curve.
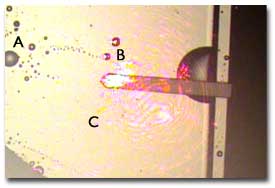
Figure 3. Video optical microscope image of a silicon
surface coated with a lubricant. Force/Position curves were measured at locations
on the surface indicated with the letters A, B, and C. The red light in the
video microscope image is from the laser used for the force sensor in the atomic
force microscope.
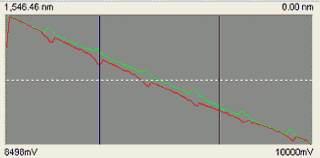
A: Force/Position curve measured on one of the droplets of lubricant.
The slope represents the force required to move the AFM probe through the liquid
surface.
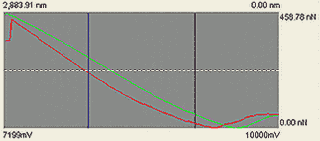
B: Force/Position curve at a place on the surface where there
is apparently a thin film of lubricant material.
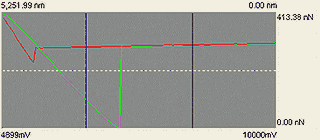
C: Force/Position curve on a section of the silicon surface
that appears to have no lubrication.
Frictional Forces
Friction between two surfaces depends
on the chemical and mechanical interaction between the surfaces. Changes
in chemical composition giving rise to friction are measurable with
the AFM. The technique for measuring these forces is called lateral
force, or frictional force microscopy.
As the probe moves over a surface in the AFM, changes in the chemical composition
of the surface can give rise to torsions of the cantilever on which the probe
is mounted. The torsion of the cantilever is then proportional to the friction
between the probe and the surface.
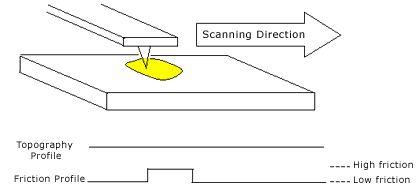
Figure 4. Illustration of the principle that allows lateral
force or frictional fore microscope images to be measured. The cantilever will
twist as the probe interacts with the surface while scanning.
Simultaneous Measurement of Topography and Friction Forces
In an AFM it is possible to simultaneously
measure topography and frictional force images. The topography image
is derived from monitoring the vertical forces on the cantilever and
the friction image is acquired simultaneously by monitoring the lateral
motions of the cantilever. Below is a FFM image of a sample illustrating
changes in the friction.
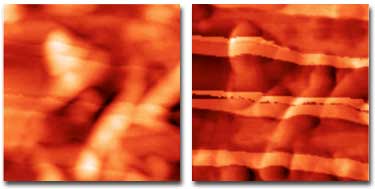
Figure 5: (left) Two dimensional view of a
composite material measured with the AFM. Barely visible in this image are striation
marks derived from a change in chemical composition at the surface. (right)
The lateral force or frictional force image of the composite material clearly
shows changes in chemical composition at the surface of the composite material.
Both the topography and frictional force image are measured simultaneously with
the AFM.
Surface
Texture / Morphology / Roughness
The AFM gives extremely high contrast on surfaces that are flat at the nanometer
scale. Optical and electron microscopes are not able to resolve surface texture
that is easily measured with the AFM. Applications include the visualization
of surface topography in both 2-d and 3-d perspectives, line roughness measurements,
and area roughness measurements. All of the traditional area and surface roughness
parameters can be calculated after the AFM image is acquired.
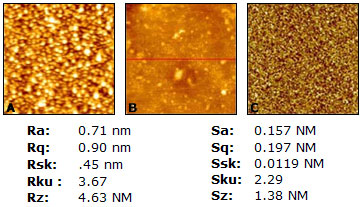
Figure 6. (A) AFM image of a metal bonding pad on a semiconductor
device (B) Use of the AFM to measure line roughness of a polymer sample (C)
AFM image of polished silicon and the area roughness of the silicon.
Nanoscale
Mechanical Properties
Mechanical properties such as hardness,
elastic modulus, stiffness and compressibility as well as material
behavior such as plastic deformation, and fracture can be studied
with the AFM.
It is possible to study nano-hardness by directly pressing an AFM probe into
a sample's surface; however, it is advantageous to use an instrument that is
optimized for nano-indentation. The primary advantage of the nano-indenter over
an AFM for nano-hardness measurements is that it is easier to get calibrated
measurements with the nano-indenter. It is useful to use the AFM to measure
the three-dimensional topography of indentations made with a nano-indenter.
AFM images allow direct visualization of material deformation or fracture behavior.
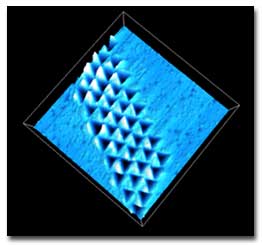
Figure 7. Three-dimensional view of nano-indents in a
material surface. From the AFM image it is possible to see the depth of the
indentation as will as visualizing the material deformation.
Using techniques such as pulsed
force mode, the stiffness of a sample at a matrix of locations is
measurable. From this data it is possible to create a stiffness mapping
of a surface. Stiffness maps can only be made on samples where the
stiffness of the surface is lower than the stiffness of the cantilever.
Such stiffness images are routinely measured on polymer samples.
Adding a fixture to the stage of
the AFM makes the study of material behavior such as plastic deformation
and fracture possible. The fixture permits creating forces on a sample
while AFM images are being taken. A variety of materials may be studied
with such a technique.
The following information was supplied by Pacific Nanotechnology