|
Carbon nanotubes possess extraordinary mechanical, physical and chemical properties including actuation behaviour on both nano and macroscale.
Up till now, several mechanisms of carbon nanotube actuation have been described. Among many one can find actuation by double-layer charge injection [1], electrostatic actuation [2], and photo-thermal actuation [3]. Double-layer charge injection is a particularly promising mechanism for nanotube actuation, where supercapacitor charging of nanotubes results in relatively large changes in covalent bond lengths. This concept, which is suggested in [4], introduces mechanism of nanotube actuation as a non-Faradaic process. Within this process charge is injected into the nanotubes and is further balanced by movement of ions in electrolyte to the surface of CNT and as result an electrical double-layer is created. Such a process makes carbon nanotube to behave as electrochemical capacitor. Additionally, injected charge causes quantum chemically based dimensional changes in the carbon-carbon bond length of the surface atoms close to the double-layer [4].
Actuation behaviour of single CNT can be translated into expansion/contraction of macroscopic structures like bucky paper. However, it should be taken into consideration that such sheet is built up of carbon nanotube bundles, where only the outermost CNTs are electrically charged what results in the reduction of actuation performance when compared with single nanotube.
Preparation of Bucky Paper
Carbon nanotube actuators can operate both on nanoscale (single nanotube) as well as at macroscale (assemblies of nanotubes).
Initial studies considering second type of actuators were conducted on bucky papers. These sheets of carbon nanotubes are formed by filtration process, during which entangled nanotubes tend to self-assemble [5].
Nanotubes (SWNT or MWNT) are first dispersed in a water solution of sodium dodecyl sulphate (SDS), where SDS plays a role of dispersing agent, by means of ultrasonication. The suspension is then subjected to centrifugation process in order to remove bigger particles like amorphous carbon or rest of carbon nanotubes agglomerates which were not broken up during sonication. Such prepared dispersion is filtered under pressure or vacuum through a microporous membrane, on which surface the nanotubes are collected. At the end of preparation process, carbon nanotube mats are washed several times with distilled water and ethanol in order to remove SDS particles present in the bucky paper. Finally, after drying at room conditions, bucky paper is peeled from the membrane. Resulting sheet of nanotubes has an average thickness of 40 µm.
These mats are highly porous and in their structure similar to regular paper. That is why they are known as “bucky paper” [5].
Actuation Measurements
Characterization of Carbon Nanotube Actuators
Characterization of carbon nanotube based actuators can be divided into two main categories. First of these categories, focuses mainly on the electrochemical performance of nanotube assemblies and involves cyclic voltammetry and exploration of CNTs behaviour in varying electrolytes.
Second category of investigations takes into consideration electromechanical aspects of the system. Here, characterization of carbon nanotube active strain, which was carried up till now, can be divided into three types of experimental investigations: measurements of individual nanotubes [6], measurement of in-plane strain of bucky paper [7,8], and out-of-plane measurements of bucky paper (strain in thickness direction of CNT structure) [9,10].
Experimental investigations on bucky paper have the advantage over the characterization of single nanotubes, that their results are more representative when considering requirements of future applications.
Out-of-Plane Measurement Set-Up
The measurement set-up, designed and constructed for the needs of out-of-plane strain characterization of bucky paper, consists of three main modules. The general view of the set-up can be seen in Figure 1.
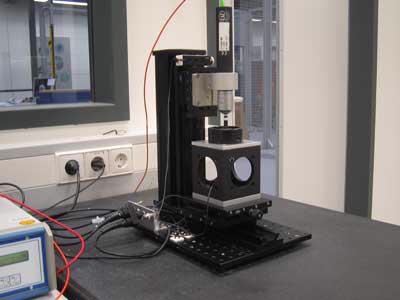
Figure 1. View of the out-of-plane actuation measurement set-up placed on the stone table with pneumatic shock absorber system.
The base module is a massive stone table, including sophisticated pneumatic shock absorber system to isolate the test system from external vibrations. In addition, to prevent any disturbances during the measurements, which can occur due to noise and vibration coming from the surrounding environment, the whole set-up is enclosed within a case constructed out of Plexiglas.
Except from the above mentioned sources of the disturbance signals, changes in the temperature of the surrounding environment can have a negative effect on the collected strain data. In order to minimize those influences, laboratory in which the measurements are performed, was equipped in the central controlled air conditioning unit. The temperature is set at the value of 21°C, not only during performance of the measurement but 24 hours a day, seven days a week. Even though, slight variations in the surrounding temperature can occur. For this reason, measurement set-up is equipped with a thermocouple which constantly measures the temperature in the near distance form the investigated bucky paper, and the results are displayed as a curve which can be later compared with strain curve in order to verify whether any change in temperature has influenced actuation of bucky paper.
The second module of the experimental set-up can be further divided into two components, where one is a three-electrode measurement cell and the second one is displacement sensor. General view of the arrangement of those components in the measurement set-up can be seen on Figure 2.
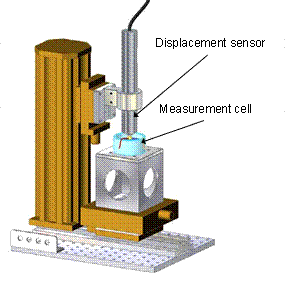
Figure 2. General drawing of the measurement set-up, with the focus on measurement cell and displacement sensor.
Measurement Cell
Measurement cell itself is in the form of container which can be filled with liquid electrolyte necessary for the actuation of bucky paper. Detailed view of this measurement cell is shown in Figure 3.
Electrodes
The main components of the measurement cell are three electrodes. The working electrode is divided into two parts, where one is fixed in the cell and the second one is free to move up and down. Bucky paper, of a circular shape with a diameter of 20 mm, is placed between these two parts of working electrode, which during the measurement are short circuited. In this way, bucky paper is also functioning as working electrode. When the voltage is applied and the charge is injected into carbon nanotubes, bucky paper starts to actuate. As a result the top electrode, which is placed on the bucky paper, starts to move up and down depending on the actuation direction. This movement is recorded by the displacement sensor and displayed as strain of bucky paper.
Counter electrode in the measurement set-up of interest has a circular form and is surrounding working electrode, including bucky paper. Both working and counter electrodes are made out of graphite. The advantage of graphite as electrode material is its stability in contact with aqueous (liquid) electrolyte. Additionally, it can be easily brought into desired shape and it has high inner surface what is a desired property in case of bucky paper measurements as it also exhibits high inner surface.
The reference electrode used in measurements of bucky paper actuation is a commercial silver/silver chloride (Ag/AgCl) reference electrode (Metrohm 6.0750.100) and together with others is immersed in the electrolyte in the near distance from bucky paper.
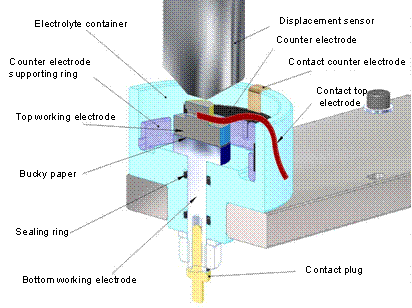
Figure 3. Detailed view of the measurement cell.
Displacement Sensor
In order to be able to measure the active strain of bucky paper, the measurement set-up is equipped with displacement sensor. Its module consists of an optical measurement system, optoNCDT 2400 from MICRO-EPSILON. In this particular case an optical sensor with the resolution of 3-10 nm is employed for precise recording of the actuation. Operation of the sensor is based on the mechanism of separation of polychromatic light into monochromatic one by the lens system inside the sensor. The change of the position of the observed surface is being calculated from spectral changes in the reflected light. In the given measurement set-up, sensor uses the surface of the top working electrode for the displacement measurement. Due to this fact, what exactly is being measured is the distance between sensor and the electrode. However, as this electrode is positioned directly on the bucky paper and is free to move, in accordance with actuation of bucky paper, the displacement data can be easily recalculated as values of bucky paper actuation.
Signal Processing Unit
The last module is a signal processing unit. The potentiostat used is a 1030PC.T. Potentiostat/Galvanostat supplied by Jaissle Elektronik GmbH, Germany. Output of this device is the potential at working electrode, in this case also the bucky paper, in volts as well as the current flowing between working and counter electrode. The input voltage, which is applied in the cell, is defined with the use of LabVIEW software.
The optical sensor, using a coherent light, directly converts the displacement of the electrode from bucky paper actuation module into the length dimension. The signal is then transferred via an RS-232 serial data cable to the personal computer. The recording and analysis of the data is conducted with a program using LabVIEW software. Simultaneously with the running measurement this program is displaying data, in forms of time depended diagrams, considering applied voltage, current, displacement and as mentioned before temperature. Example of such a measurement window with the above mentioned data can be seen in Figure 4.
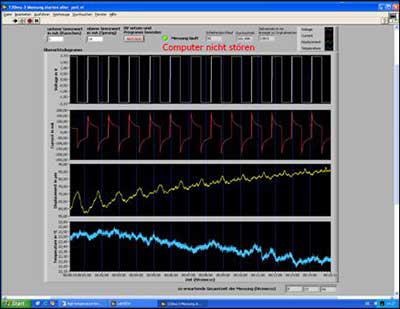
Figure 4. Measurement window from the LabVIEW software displaying time dependent data of voltage, current, displacement and temperature during running measurement.
Additionally, from the data collected by the LabVIEW program it is possible to calculate further values useful for characterization of bucky paper like charge injected into nanotubes, efficiency of the actuator and energy density. These calculations are supported by the use of Excel or Origin software.
Results and Discussion
The above described measurement set-up was involved in the series of investigations of bucky paper actuation performance. Within these tests, samples were subjected to varying potential input signals, were operated within several kinds of electrolytes and additionally their performance under applied load was investigated. The main focus, in case of each experiment, was paid to the displacement generated by nanotubes. Example curve of actuation plotted together with the potential signal in respect to the duration of the measurement is represented in Figure 5.
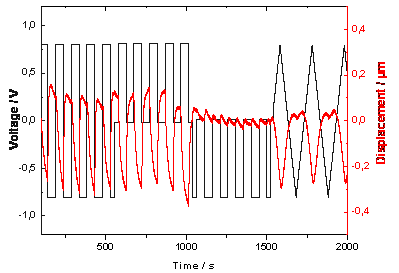
Figure 5. Actuation curve plotted together with the input potential signal.
Displacement Curve
As mentioned earlier in order to obtain the data (curve) representing displacement of bucky paper, the results obtained form the measurement have to be inverted. It is needed to be done due to the fact that during experiment sensor is recording the movement of the top working electrode and not the actuator directly. In other words when the sensor records that the distance from the electrode is increasing that means that the actuator is contracting. Respectively, when the distance between electrode and sensor is decreasing, it is result of bucky paper expansion. The displacement curve obtained directly from the measurement with the description how it should be translated into bucky paper actuation is presented in Figure 6.
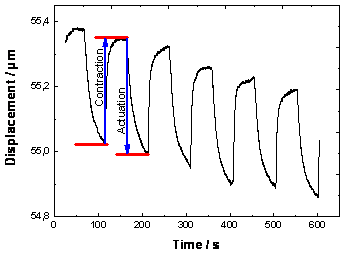
Figure 6. Explanation of how the displacement curve should be analysed as the original curve is representing the change in the distance between sensor and the top working electrode.
Elimination of Drift in the Results
Additionally, it can be seen that the resulting curve is not free of drift, even though any disturbing vibration form the environment was eliminated thanks to employment of shock absorber system and the influence of temperature variations was overcame by use of temperature control in the measurement surrounding. However, two other potential sources of drift in the measurement were defined. Both of them are directly connected to the bucky paper and the conditions in the measurement cell. First source, which results in expansion of bucky paper during the measurement and creates a downward drift, is caused by swelling of bucky paper after immersion in electrolyte. In order to overcome this effect it is recommended to immerse the sample in the electrolyte for a certain time before the measurement. In this way the tested sample will be already in the swollen state, where all the pores are filled with electrolyte and just the actuation caused by charge injection will be measured.
The second reason for the occurrence of drift in the results, however in this case in the upward direction, what indicates contraction of the sample, is observed due to the creep of the bucky paper. This behaviour is caused by placing the electrode on the surface of the bucky paper. Same as in the first case, this effect can be minimized or eliminated by a pre-treatment of the sample. An electrode or additional load should be applied on the sample at the specific time before the measurement until the stable state of the material will be reached. In this way drift will be excluded and only the real contraction of nanotubes will be measured.
First set of measurements was performed in order to compare the actuation behaviour of bucky paper composed of SWNT or MWNT as well as to find the relation between the actuation of nanotubes and the amplitude of applied voltage. Results of these experiments are summarized in the form of block diagram in Figure 7.
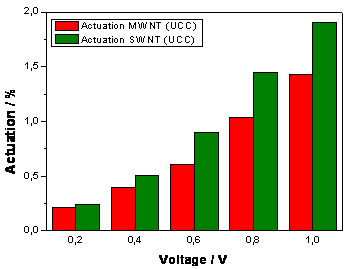
Figure 7. Comparison of actuation performance of SWNT and MWNT bucky papers with respect to the applied voltage.
Actuation Behaviour of SWNT and MWNT
First conclusion that can be drawn from these data is that irregardless whether bucky paper is composed of SWNT or MWNT, both structures exhibit actuation behaviour. Additionally, both kinds of samples follow the same trend of increasing performance with increasing voltage input. However, at higher potential the percentage increase in actuation is higher in case of SWNT bucky paper. When performing measurements where the input potential is one of the variables the attention should be paid that it is not exceeding the electrochemical window of the electrolyte in use. As all electrolytes used for investigations presented in this paper are water based salt solution, the input voltage can not be higher than 1 volt. In case when this voltage is exceeded it can not be confirmed whether collected results are representing actuation of the bucky paper or they are strongly influenced by the hydrolysis reaction of electrolyte. For the safety reason all following experiments, which involved aqueous electrolytes, were performed with potential of ± 0,8 volt.
Actuation Mechanism and Performance
The other observation based on the results obtained form the above mentioned investigation is considering the mechanism of actuation. Namely, it can be seen that at the potential values of 0,8 and 1 volts the actuation, calculated in percent with respect to the thickness of the bucky paper, is exceeding the value of maximum theoretical actuation of carbon nanotube, which is ~1 % [4]. That suggests that the expansion/contraction of carbon-carbon bonds in nanotubes is not the only actuation mechanism causing the movement of the whole structure. It is implied that the remaining actuation is generated by the movement of ions form the electrolyte in between the nanotubes in their assembly what causes the change in the distance between nanotubes and as a result changes in the volume of the whole bucky paper. In such case in order to obtain the optimum actuation performance of the bucky paper it is crucial to choose most suitable electrolyte which will enhance actuation of bucky paper.
Measurements Under Load
Measurements involving different kinds of electrolytes, where all of them were water based solutions of varying salts, were coupled with the investigations of actuators performance under application of additional load on the surface on the bucky paper.
The investigations with load were performed by application of additional weights on the top working electrode, which is later positioned on the bucky paper. Such weights can have varying size as well they can be produced from different material in order to have a possibility of load variations. However, there is still a limitation to the possible load as the free space between top electrode and the sensor is limited. Experimental set-up with the view of electrode and weights is shown in Figure 8.
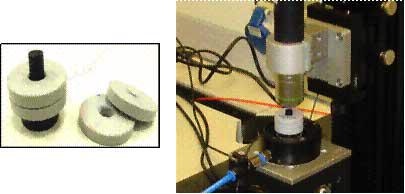
Figure 8. Weights added on the top working electrode used to investigate performance of bucky paper under additional load.
Those tests were performed due to expectation that with a certain additional load applied on the bucky paper the actuation of the whole structure will be improved. This assumption is based on the fact that bucky paper is a porous assembly of nanotubes with a high roughness of the surface and moreover after the preparation process, especially from peeling the bucky paper from the membrane, resulting sample can be slightly bended. All these may result in the poor quality of contact between actuator and electrode, what in turn can lead to creation of hot spots and charging of carbon nanotubes only at the specific points of the bucky paper.
Results of these investigations, however, can not fully support this idea as only some samples followed the predicted trend. Dependency of the bucky paper actuation on the applied load, which in this test series varied from 4 g (just electrode) up till 125 g, is shown in Figure 9.
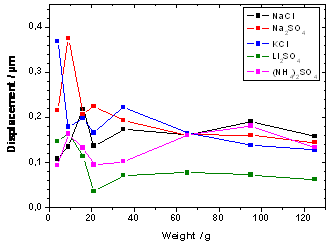
Figure 9. Results of the investigation on bucky paper actuation when tested in varying electrolytes and with application of increasing weight on the surface of the sample.
Actuator Behaviour of Bucky Paper Under Load
The biggest influence of the load application can be observed in the range of lower values, from 4 grams, so when only electrode is used, up till approximately 40 grams. However, it is not always that the application of small load results in the improvement of actuation as was expected. In fact this behaviour is very irregular and at the moment does not allow drawing any conclusions about its influence on the actuation of nanotube structures. Further more in the range of 40 to 125 grams for the applied weight there is basically no significant change in the performance of the actuator, what also is not the predicted behaviour. It would be rather expected that at the beginning with increasing load the actuation would be growing higher due to improvement in the contact between sample and electrode, however, at higher loads would start decreasing as the force that actuator has to generate in order to expand would be also growing higher. In contradiction to varying response of the bucky papers in the low load range, at the higher values all the samples measured gave similar results.
Even though, most of the samples in this investigation exhibited similar trend in their actuation behaviour, it can be seen that kind of electrolyte used has an influence on the bucky paper performance. After this set of tests the preferred electrolyte is Na2SO4 and it will be used as a standard electrolyte for all future investigations. This choice was based on the fact that actuation of bucky paper in this medium shows highest values and additionally, when the performance of the sample is not influenced by the load applied on its surface, the results are most stable for this electrolyte. It is suggested that this salt is the preferred choice due to the size of ions present in the solution which can easily penetrate bucky paper structure and arrange themselves in-between nanotubes and their movement is the fastest with the given driving voltage. Size of the ions has an influence on the actuation of bucky paper in case when we assume that the actuation mechanism is not only dependent on the carbon-carbon bond length change but also on the movement of the ions between nanotubes in the assembly. The speed of ion diffusion has an influence on the actuation for the electrochemical double-layer mechanism because the faster ions can move the faster this double-layer will be created and the nanotube will expand or contract.
Conclusions
The actuation measurement set-up presented within this paper is a useful device for characterization of electromechanical properties of bucky paper. The main focus is paid to the out-of-plane actuation, which means in the thickness direction of the sample.
Employment of this measurement set-up allowed performance of series of experiments to characterize actuation behaviour of bucky papers (SWNT and MWNT) with dependence on applied voltage, electrolyte used as well as performance under additional load applied on the sample.
Use of the shock absorber system coupled with control of the temperature of the surrounding environment allowed to remove disturbance noise or vibration from the measured data. However, even though all those precautions were taken, the resulting data is not free from drift, which adds difficulty to the actuator performance analysis. For this reason, it is suggested to subject bucky paper to the pre-treatment before starting the measurement. These can involve immersion of the sample in the electrolyte, which is to be used during tests, as well as application of the pre-load. The easiest solution is to place the sample in the measurement set-up, filled with electrolyte, at the defined time before performance of the measurement.
For the future analysis and better understanding of the actuation mechanism of bucky paper it is recommended to conduct galvanodynamic tests, current/charge controlled, for which the present measurement set-up is also suitable.
Acknowledgements
This work was supported by the EU Specific Targeted Research Project DESYGN-IT (No NMP4-CT-2004-505626)I.
Authors want to express their gratitude to National University of Ireland, Cork, for the preparation of the bucky papers, which were used in these investigations as well as to the people working in the CNT Laboratory at Fraunhofer TEG for performing the measurements.
References
- P. Kim, C.M. Lieber, Science, 286, 2148-2150 (1999)
- Y. Zhang, S. Iijima, Phys. Rev. Lett., 82, 3472-3475 (1999)
- Electroactive Polymer (EAP) Actuators as Artificial Muscles: Reality, Potential, and Challenges, Second Edition”, Y. Bar-Cohen (Ed.), SPIE Press, Vol. PM136 (2004)
- Rinzler, A. G., J. Liu, H. Dai, P. Nikolaev, C. B. Huffman, F. J. Rodriguez-Macias, P. J. Boul, A. H. Lu, D. Heymann, D. T. Colbert, R. S. Lee, J. E. Fischer, A. M. Rao, P. C. Eklund, R. E. Smalley. Applied Physics a-Materials Science & Processing 67, 29-37 (1998)
- S. Roth, R.H. Baughman, Current Applied Physics 2, 311-314 (2002)
- J.N. Barisci, G.M. Spinks, G.G. Wallace, J.D. Madden, R.H. Baughman, Smart Mater. Struct. 12, 549-555 (2003)
- G.M. Spinks, G.G. Wallace, Lu Liu, Dezhi Zhou, Mat. Res. Soc. Symp. Proc. Col. 698 (2002)
- M.H. Haque, I. Kolaric, U. Vohrer, T. Wallmersperger, B. Kröpplin, Proc. SPIE, Vol. 5385 (EAPAD) ed. Y. Bar-Cohen (2004)
- U. Vohrer, I. Kolaric, M.H. Haque, S. Roth, U. Detlaff-Weglikowska, EMRS 2003 Spring-Meeting, June 10-13, Strasbourg, France (2003)
|