The SPIP™ Force Curve Analysis Module offers efficient tools for the analysis, transformation, and reporting of force curves and force volume images.
The module automatically detects critical points like the point of detachment, identifies the maximum pulling and loading force, and fits different models to the data.
The Worm Like Chain Model used in pulling experiments can be fitted to all rupture events. SPIP™ is capable of calculating Young’s modulus from indentation curves by employing the cone-flat Sneddon model or the sphere-flat Hertz, DMT and JKR models (Figure 1).
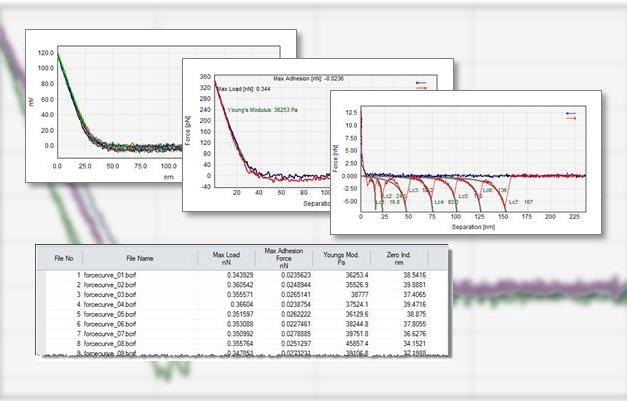
Figure 1. SPIP can calculate Young’s modulus from indentation curves, and fit the WLC model to pulling curves, top image
SPIP™ not only analyzes average curves or individual curves from force volume images, but also generates stiffness maps, Young’s modulus maps, constant force maps, and adhesion maps, among others.
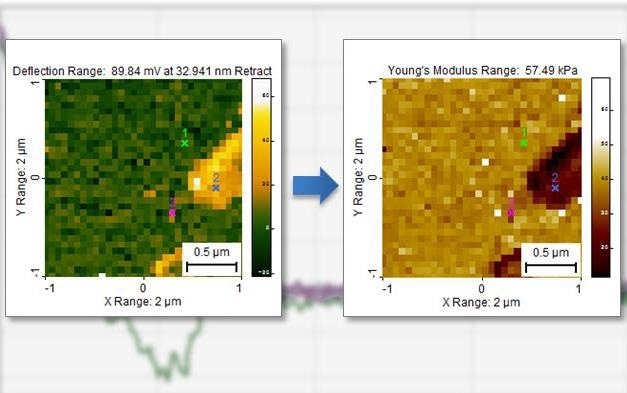
Figure 2. SPIP™ can generate Young’s modulus maps, constant force maps, and more
SPIP™ not only analyzes average curves or individual curves from force volume images, but also generates stiffness maps, Young’s modulus maps, constant force maps, and adhesion maps, among others.
Results of individual force curves are provided with statistics, and can be easily exported to other programs.
Features of the Force Curve Analysis Module
- Transformation of deflection vs. height into force vs. separation
- Automatic event detection
- Worm Like Chain Model fits with evaluation of unloading rate
- Young’s modulus using Sneddon and Hertz indentation models
- Full user control or automatic fit
- Collection of results for numerous force curves
- Force volume image analysis including constant force mapping and Young’s modulus mapping, adhesion mapping, among others
- Batch processing of files in large numbers
The Benefits of SPIP™
- Compatible – SPIP™ meets all SPM feature requirements for over 100 different file formats, and can be used across various microscope platforms,
- Accurate – SPIP™ is strongly rooted in metrology and is extensively used for its processing accuracy and resulting analysis and offers unparalleled accuracy and detail
- Easy to use – An intuitive Windows-based user interface in SPIP™ features ‘how to’ tutorials and image examples for a host of use-cases and applications
- Efficient – Users can stay productive with custom-made automation and reporting tools
- Professional – Dedicated software development and technical support team with non-stop focus on delivering the best: SPIP™ continues to be a golden standard in SPM image processing and analysis
- Compelling visuals – Complete visualization tools enable personalization and adjustment of image presentations
- Publication – SPIP™ is extensively used for research purposes and has been referenced in more than 1,000 scientific publications
Download a Free Trial of SPIP™
The Different SPIP™ Packages
Premium
Complete package with all SPIP™ functions.
Suitable for scientists and metrologists using SPM’s, 3D profilers and SEM’s working with advanced image analysis, force- and tunneling spectroscopy and who needs for automation.
Standard
Medium package with the most standard SPIP™ functions.
Suitable for engineers and scientists who do advanced analysis of image data from SPM’s, 3D profilers and SEM’s or TEM’s.
Starter
Small package with the most basic SPIP™ functions.
Suitable for anyone working with SPM or 3D profiler data who wants an efficient platform for data browsing and image inspection

This information has been sourced, reviewed and adapted from materials provided by Image Metrology A/S.
For more information on this source, please visit Image Metrology A/S.