The SPIP™ Particle & Pore Analysis module allows users to easily detect and quantify grains, pores, particles, cells and other details with boundaries in an image.
Features of the Particle & Pore Analysis Module
Users can either use a standardized technique for fast and easy results, or can opt for a different detection technique to suit the specific surface details of various surfaces. Users can also adjust the settings to suit their unique requirements.
Post Processing
The module is available with numerous easy-to-use post-processing tools. Users can remove unnecessary pores or particles depending on their shape or size. The tools can also be used to smooth the detected contours.
Various Display Options
Users can choose from numerous display modes such as fiber, semi-transparent, filled, skeleton and contour mode, for the detected details. Particles can also be colored by parameters such as area, aspect ratio, or height.
Classification Editor
The classification tools allow users to group the detected pores and particles into different categories based on their characteristics, including size, geometrical shape, or height.
Classification results can be visualized in new charts, and reports for series of images completing the task can also be generated (Figure 1).
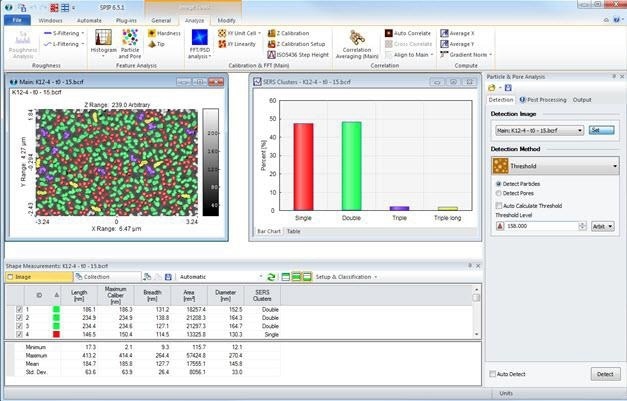
Figure 1. SPIP™ Particle & Pore Analysis module enables users to classify and visualize results.
Collections
Often statistical significance is achieved by recording several images from different parts of the studied surface. With Collections, particles detected over many images can be accumulated into one big table so that statistics and charts, and classifications can be generated from a sufficiently high number of particles.
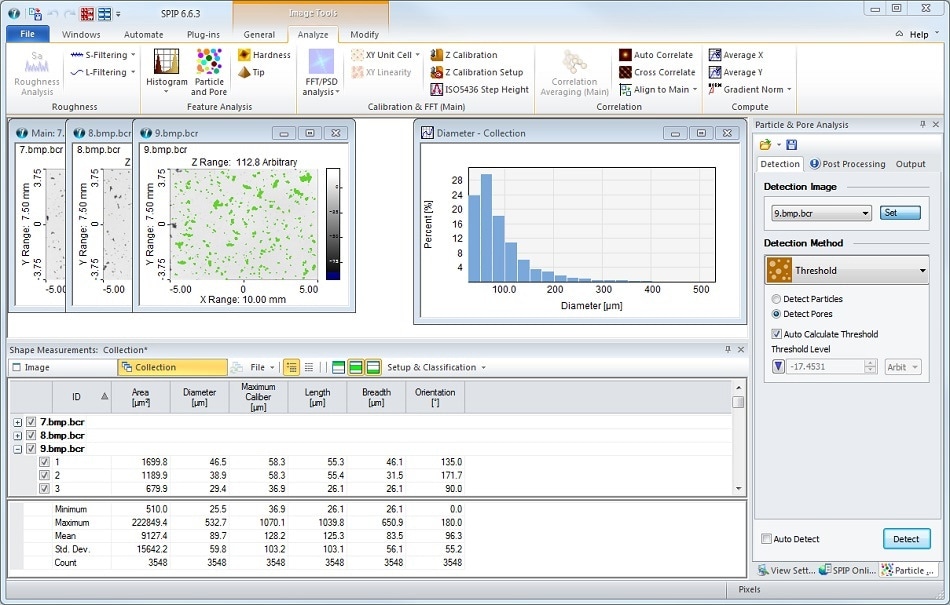
Figure 2. SPIP™ particle Collection result. Detected particles are accumulated over many images to achieve statistical significance.
Reporting and Automation
The automation facility enables users to efficiently conduct batch processing of images in large numbers. Reports can be obtained in either HTML or MS Word format, to complete the work.
The Benefits of SPIP™
- Compatible – SPIP™ meets all SPM feature requirements for over 100 different file formats, and can be used across various microscope platforms,
- Accurate – SPIP™ is strongly rooted in metrology and is extensively used for its processing accuracy and resulting analysis and offers unparalleled accuracy and detail
- Easy to use – An intuitive Windows-based user interface in SPIP™ features ‘how to’ tutorials and image examples for a host of use-cases and applications
- Efficient – Users can stay productive with custom-made automation and reporting tools
- Professional – Dedicated software development and technical support team with non-stop focus on delivering the best: SPIP™ continues to be a golden standard in SPM image processing and analysis
- Compelling visuals – Complete visualization tools enable personalization and adjustment of image presentations
- Publication – SPIP™ is extensively used for research purposes and has been referenced in more than 1,000 scientific publications
Download a Free Trial of SPIP™
The Different SPIP™ Packages
Premium
Complete package with all SPIP™ functions.
Suitable for scientists and metrologists using SPM’s, 3D profilers and SEM’s working with advanced image analysis, force- and tunneling spectroscopy and who needs for automation.
Standard
Medium package with the most standard SPIP™ functions.
Suitable for engineers and scientists who do advanced analysis of image data from SPM’s, 3D profilers and SEM’s or TEM’s.
Starter
Small package with the most basic SPIP™ functions.
Suitable for anyone working with SPM or 3D profiler data who wants an efficient platform for data browsing and image inspection

This information has been sourced, reviewed and adapted from materials provided by Image Metrology A/S.
For more information on this source, please visit Image Metrology A/S.