Full Featured Atomic Force Microscope with Powerful Analytical Capabilities
- Unique quantitative Mechanical Property mapping
- High resolution imaging
- Nanoscale thermal analysis and SThM
- Easy to use AFM with fast time to data even for beginners
- All standard electrical and mechanical imaging modes
Mechanical Property Mapping
AFM+ Mechanical
Operators can collect mechanical properties of their choice by using a contact resonance method to simultaneously map stiffness variations with the topography.
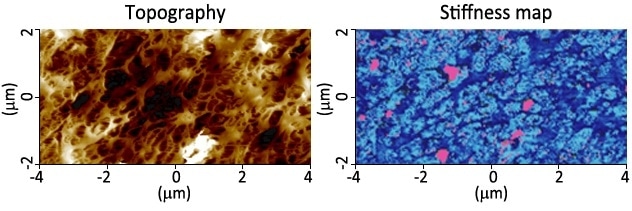
A 4 µm x 8 µm topography image and stiffness map of a three-component polymer blend. The stiffness map, which measures the variation in modulus by analyzing the contact resonance of the cantilever, clearly resolves the three materials.
Nano-mechanical and Nano-thermal Property Mapping
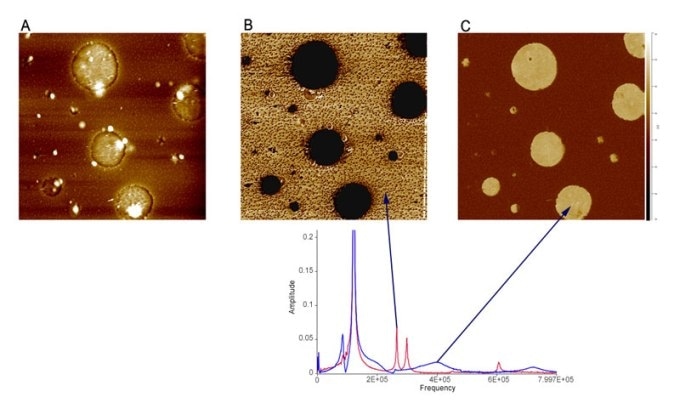
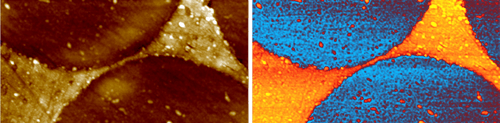
Lorentz Contact Resonance (LCR) simplifies component selective imaging in polymer blends. Above: Height (left) and LCR images (center, right) of a blend of polystyrene (PS) and low density polyethylene (LDPE). The LCR images were obtained at two different contact resonance frequencies corresponding to strong resonances of the PS (center) and LDPE (right).
Life Science
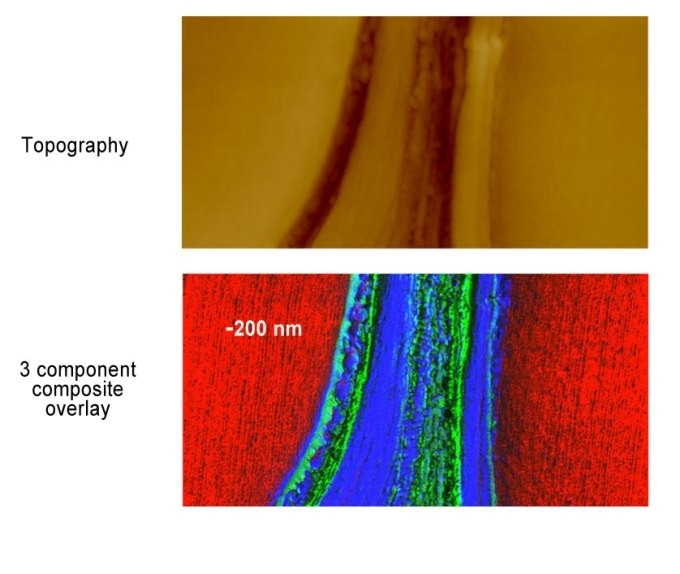
Picture 4. Height (top) and Lorentz Contact Resonance composite image (bottom) of wood cell walls. The bottom image is a three color overlay obtained at three different contact resonance frequencies selected to highlight the different wood cell components.
Nanoscale Thermal Analysis
Nanoscale Thermal Analysis (nano-TA)
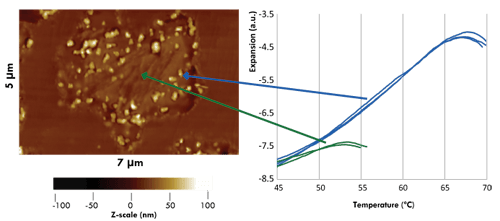
An AFM image with nano-TA data of a toner particle. The particle was embedded in epoxy and microtomed. The topography of the sample shows variations in structure, which can then be analyzed using nano-TA. Toner particles include a number of components (wax, resin, dye, etc.) that exhibit different transition temperatures.
Scanning Thermal Microscopy (SThM)
The 4 µm x 8 µm image shown here utilizes the scanning thermal microscopy (SThM) functionality of the afm+ system on a carbon fiber – epoxy composite sample. The sample was cut and polished to form a smooth surface. The height image (left) shows a number of carbon fibers, while the SThM image (right) shows the change in probe temperature on the two materials due to their differences in thermal conductivity. This sample demonstrates the high lateral-resolution capability of the SThM technique.
Transition Temperature Microscopy
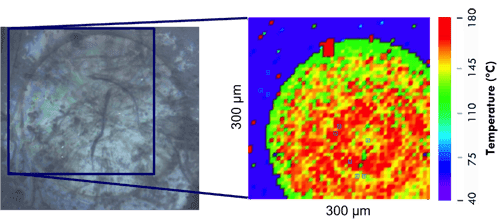
An optical image and a TTM map of a banded spherulite composed of poly (L-lactic acid) (PLLA). This TTM map was created by using the motorized XY stage. The blue areas in the TTM map are amorphous PLLA; the red and yellow areas are crystalline areas. The “onion-like” structure in the spherulite was created by stepping the temperature back and forth during the crystallization process to create regions with a higher or lower degree of crystallinity. Sample courtesy of J. Morikawa, Tokyo Institute of Technology.
Upgradeable Analytical Capabilities
The new afm+ can be fully upgradeable to the company’s nanoIR system, probe-based measurement device that utilizes infrared spectroscopy to show chemical composition at the nanoscale. The nanoIR also delivers high-resolution characterization of thermal, mechanical and topographic properties. Potential application areas include materials science, polymer science and life science, including comprehensive studies of structure-property relationships.
AFM+ IR Spectroscopy
- IR spectra that correlate to FTIR libraries
- Point-and-click nanoscale IR spectroscopy
- Chemical imaging
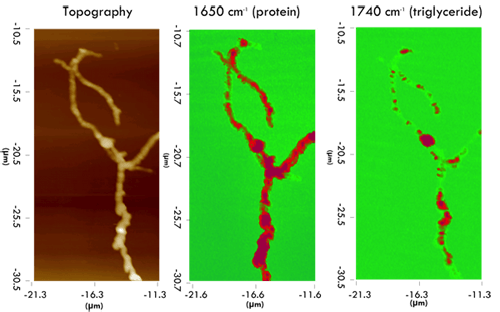
Topography and IR images collected at 1650 cm-1 and 1740 cm-1 of Streptomyces bacteria. These bacteria form lipid-filled vesicles in later stages of growth. The location of these vesicles can be determined by imaging at 1740 cm-1, an absorption band specific to the lipid. The vesicles can be resolved to sub-100 nm resolution using the nanoIR.
Multifunctional Nanoscale Measurement Suite
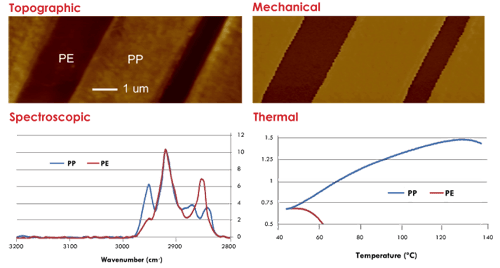
An example of the multi-property measurement capability of the nanoIR system. The sample is a multilayer film composed of polyethylene and polypropylene. The two materials can be clearly identified by their unique absorption bands. In addition, the difference in stiffness and transition temperature of the two materials can be measured.
![]()
![]() Download the Brochure for More Information
Download the Brochure for More Information
The AFM+ from Anasys Instruments