cryoRaman, developed jointly by Oxford Instruments and attocube systems AG, enables extremely low-temperature measurements using Raman imaging with unsurpassed spatial resolution. It was designed for scientists looking into materials that exhibit novel properties as they are cooled to almost absolute zero.
The performance and versatility of the witec360 microscope series, along with advanced cryostat and nanopositioner technology, enables researchers to investigate samples under extreme conditions.
cryoRaman offers a strong standard feature set that can be supplemented by a wide range of accessories for configurations that address both established and emerging challenges.
Key Features
- Low-vibration closed-cycle cryostats
- Solenoid magnets with a strength of up to 12 Tesla or vector magnets
- 1.8 Kelvin to 300 Kelvin operating temperatures
- Full polarisation control in excitation and detection
- Unique cryogenic-compatible Raman-specific objectives
- Excitation wavelengths from VIS to NIR with optimised spectrometers
- Exceptionally precise low-temperature nanopositioner
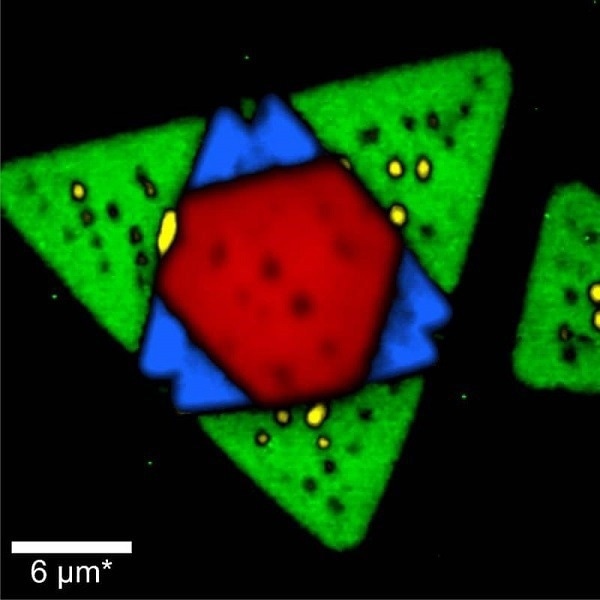
Raman image of tungsten diselenide (WSe2) recorded at 120 K. Areas with one (green), two (blue), and three (red) layers were clearly identified from their Raman spectra. Image Credit: Oxford Instruments
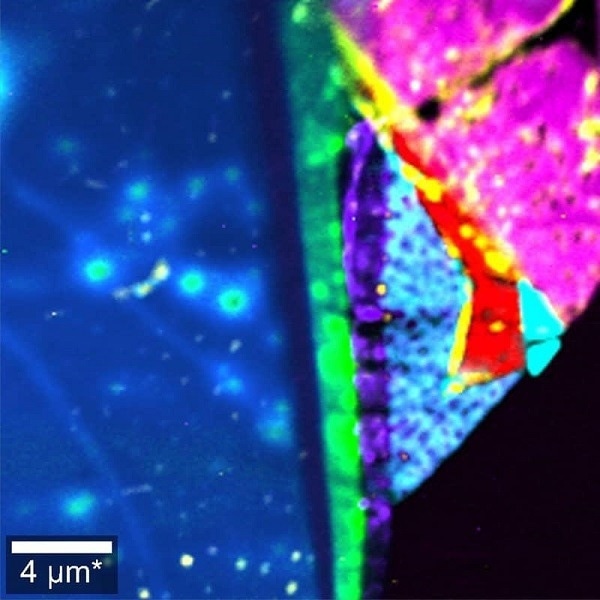
Raman image of a MoS2/WSe2 heterostructure recorded at 2 K. The colors represent different layer numbers, compositions, and orientations. Image Credit: Oxford Instruments
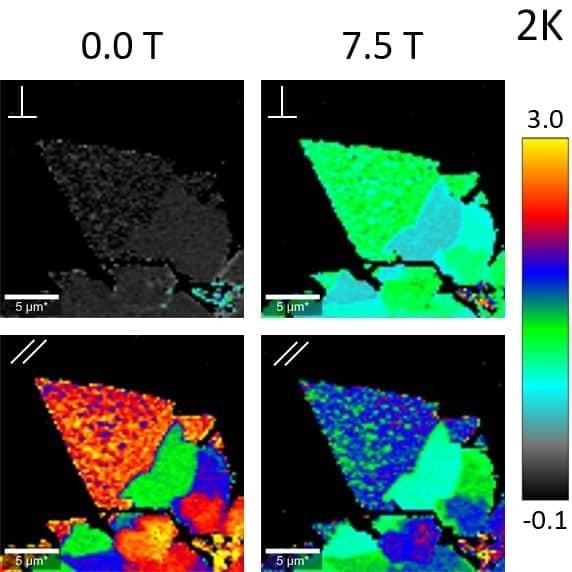
Polarization- and magnetic field-dependent Raman images of single- and multi-layer MoS2 at 2 K.
The A’1 /E’ intensity ratio is color coded. The polarizer and analyzer were oriented perpendicular or parallel to each other as indicated. Image Credit: Oxford Instruments
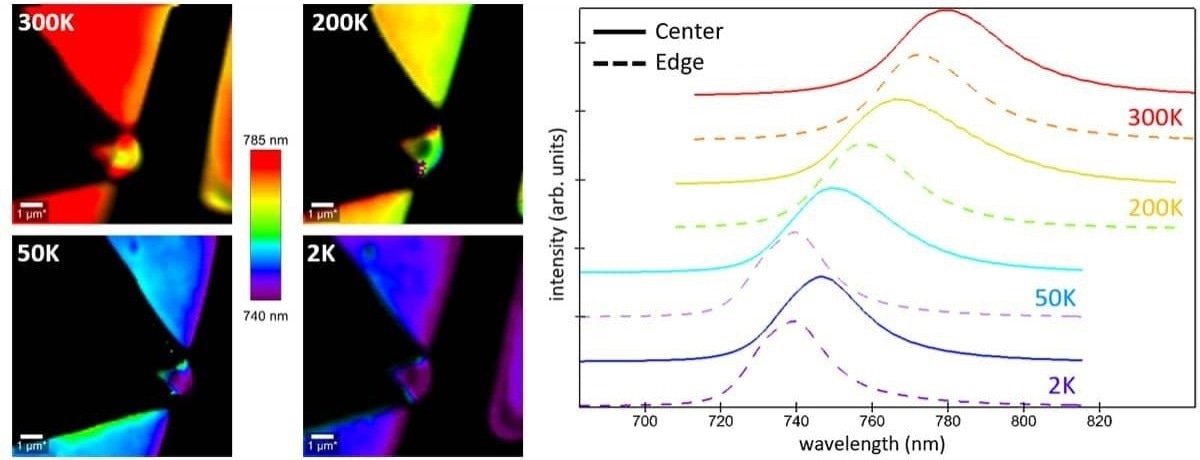
Temperature-dependent shift of photoluminescence (PL) spectra for WSe2. The PL images at different temperatures (300 K, 200 K, 50 K, and 2 K) are color coded according to the PL peak position. The normalized PL spectra for each temperature are color-coded accordingly, with solid and dashed lines representing spectra from the center and outer edges of the single layer, respectively.
Image Credit: Oxford Instruments